How integrated is Tulsa? A 2010 update
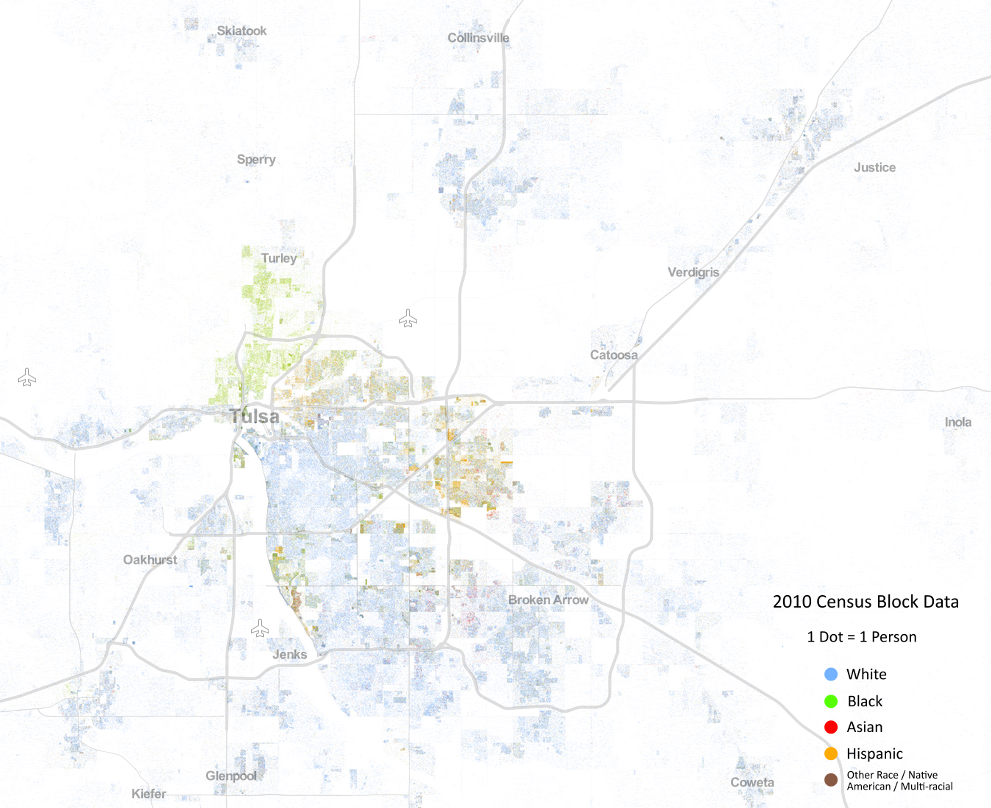
An interactive demographic map -- called the "Racial Dot Map" -- is making the rounds. The map is by Dustin A. Cable, Weldon Cooper Center for Public Service at the University of Virginia. Each dot on the map represents one person from the 2010 U. S. Census, located within the census block and color-coded according to the self-selected racial and ethnic categories listed on the census form.
Overlooking the racial coding for a moment, the map beautifully depicts the great urban conglomerations and the strings of settlement along the highways that cross the sparsely-settled Great Plains. The voids on the map include the Great Lakes, the Mississippi River, the mountain ridges of central Pennsylvania, the Okefenokee and the Everglades, and the Sierra Nevada. Zooming in on Tulsa, you can see the Bird Creek floodplain that divides Owasso and Collinsville from Tulsa and its adjoining cities and towns. It's a negative of what you would see with a nighttime satellite view.
This Land Press editor Michael Mason posted a link to the map on Facebook with the comment, "Ugh. This just-released map reveals Tulsa's racial divide."
Zoomed out, the map shows areas of predominance, with the highest concentration of African-Americans west of US 75 and north of Edison St. Other areas show concentrations of Hispanics. The area north of 11th Street and east of US 75 appears to be the most evenly mixed.
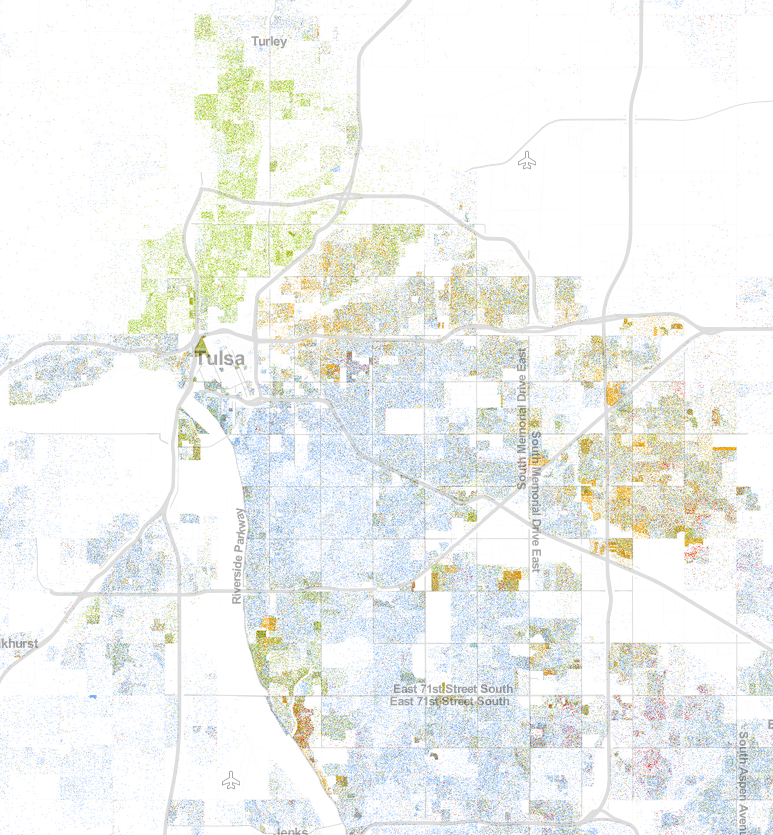
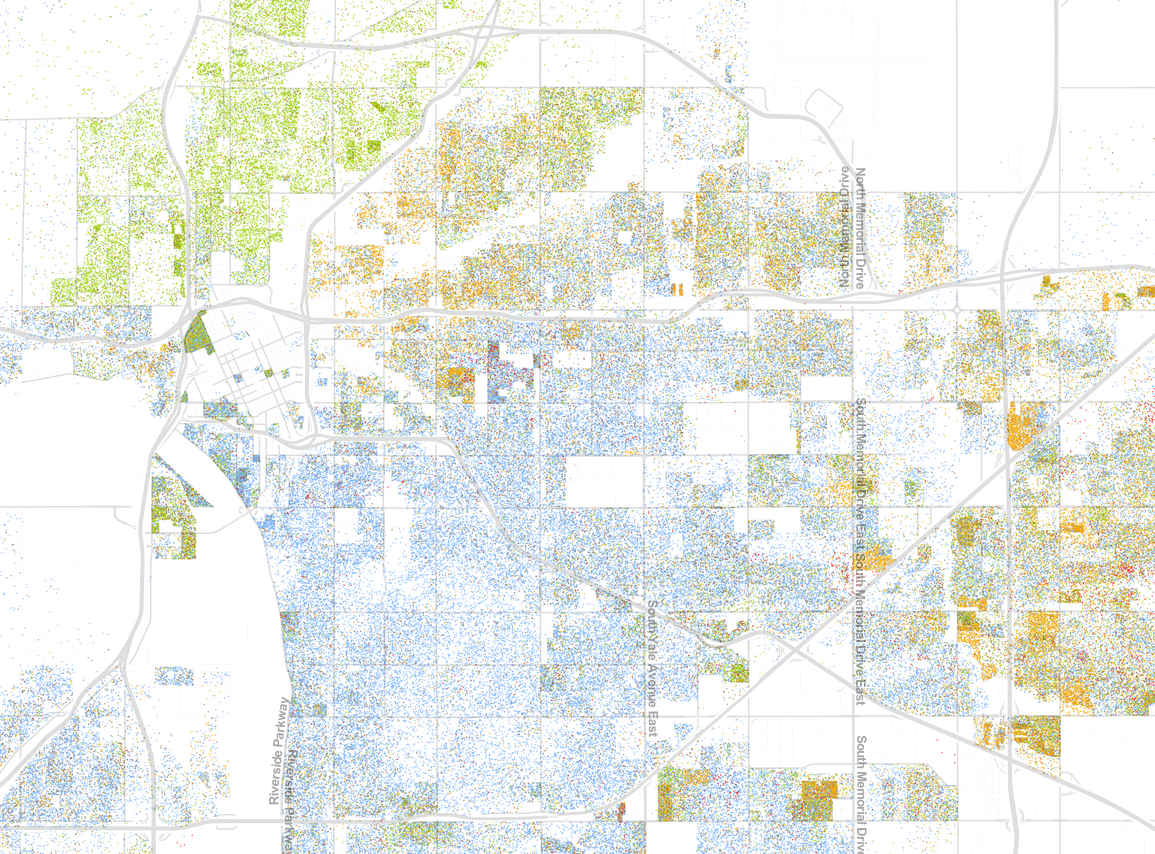
But zoom in further, and you'll see dots of every color in every part of every square mile of the city. A study of the 2000 census showed that 64% of the African-Americans in the Tulsa metro area lived on blocks that were less than 80% black. (That link also has stats on racial integration -- the lack thereof -- in the 1960 census, and a map showing the concentrated area in which 91% of African-Americans lived.)
That study hasn't been updated yet for the 2010 census, but some enterprising amateur demographer could download the data from the website and run the numbers. I suspect that the long-term trend of diversification has continued, with more members of racial and ethnic minority groups living in majority / majority neighborhoods.
What I wrote about that earlier study bears repeating:
So we've gone from over 90% of blacks living in a small part of the city in 1960 to living all over the metro area -- 64% outside of predominantly black areas -- in 2000. That seems like progress to me, but the authors of the research don't rank Tulsa as significantly integrated (see their maps of Tulsa) because there are so few blocks on which the population is at least 20% black and at least 20% white. In a city where the overall black population is less than 20%, that doesn't seem like a good measurement of integration.Of course, geographical integration isn't necessarily a good measure of social integration either, as we tend to connect with people we know from church, school, and work and may not spend much time with our own neighbors.
After the jump, snapshots of Tulsa on the racial dot map at different zoom levels.
0 TrackBacks
Listed below are links to blogs that reference this entry: How integrated is Tulsa? A 2010 update.
TrackBack URL for this entry: https://www.batesline.com/cgi-bin/mt/mt-tb.cgi/6962
Hey, thanks for linking/showing that map. Maybe it can help me decide where to move, as my neighbourhood is becoming increasingly 'diverse'...along with the attendant crime/vandalism, lack of home maintenance and decreasing property values.
http://whitegirlbleedalot.com/black-mob-violence-in-oklahoma-the-real-story/
and
http://whitegirlbleedalot.com/oklahoma-was-horrific-but-not-unique-or-even-rare/
a couple of good views on 'diverse neighbourhoods'
start looking at reality.
It makes me wonder where Mr. Mason lives. I've never met him, but as a white woman living in a very integrated neighborhood, I've often found that people who make those sorts of remarks are shocked when I tell them where I live and, I think, embarrassingly scared or nervous.
For the record, I really love my north Tulsa neighborhood and my current neighbors are much more friendly and less violent than those I had in my adjacent-to-Florence-park neighborhood.
@ Roxanne,
Perhaps the reason society is still segregated because the populations choose where they want to be. Heaven forbid that proponents of "vibrancy" consider the phenomenon of voluntary segregation. Most of the time, people just want to be with their own ethnicity. There is nothing wrong with this. It's been this way since the beginning.
Also, consider the idea that a lot of people choose not to start populating one-sided ethnic areas for their own safety's sake. Most white people choose not to live in a black section of town if they can help it. Most Hispanics also choose not to live in the black section of town. Ironically, both black and Hispanic ethnicities have no problem with moving into white neighborhoods due to low crime rate. Whites are known for "keeping it together."
Fun fact! Tulsa has the 5th most dangerous neighborhood in America! Can you guess where it is?
If you guessed Northwest Springdale, you're right! Have fun finding it on the race map.