Maps Category
What was here? Who owned it? What did it look like? There are a number of resources available for reconstructing Oklahoma's geographical past, and they're easier to use than ever. These are my go-tos when researching the history of a neighborhood or answering questions about the past. This is an encyclopedic article, so if you're on the home page, you'll have to click the "Continue reading" link to see all of it.
These links will take you to specific sections of this article:
- Oklahoma Historical Aerial Digitization Project: Geotagged historical aerial photos going back to the 1930s
- Oklahoma Aerial Photo Inventory: A broader collection of imagery, including some not yet geotagged
- EarthExplorer: US Geological Survey aerial imagery: Higher resoution aerial photos from the 1950s through the 1970s, plus satellite and other imagery
- topoView: US Geological Survey historical topographical maps: Maps for Oklahoma from 1901
- US Bureau of Land Management Land Records: Township survey plats of Indian Territory from the 1890s, with field notes from the surveyors
- Oklahoma State University McCasland Maps Collection: Includes historical county highway maps as early as 1937, plus USGS topo quads not in the topoView collection
- WPA 1936 land ownership and valuation maps: Interactive statewide browser
- Tulsa Sanborn Fire Insurance Maps at Library of Congress: Building-by-building detail from Tulsa's earliest days through 1915, 1939, and 1962
- Tulsa Census Enumeration District and Census Tract Maps: Base street maps and boundaries of statistical neighborhoods
- Tulsa County Clerk Subdivision Plats and Deed Indexes
- Tulsa County Assessor Static Section Maps
- Miscellaneous Maps of Tulsa
Before Eisenhower's Interstate Highway System, before state highway officials collaborated to create a national highway numbering system in 1926, motorists traveling cross-country followed turn-by-turn directions contained in the Official Automobile Blue Book. These books are a time capsule of transportation history, not only mentioning routes, but road conditions, locations of hotels, garages, train stations, and trolley tracks.
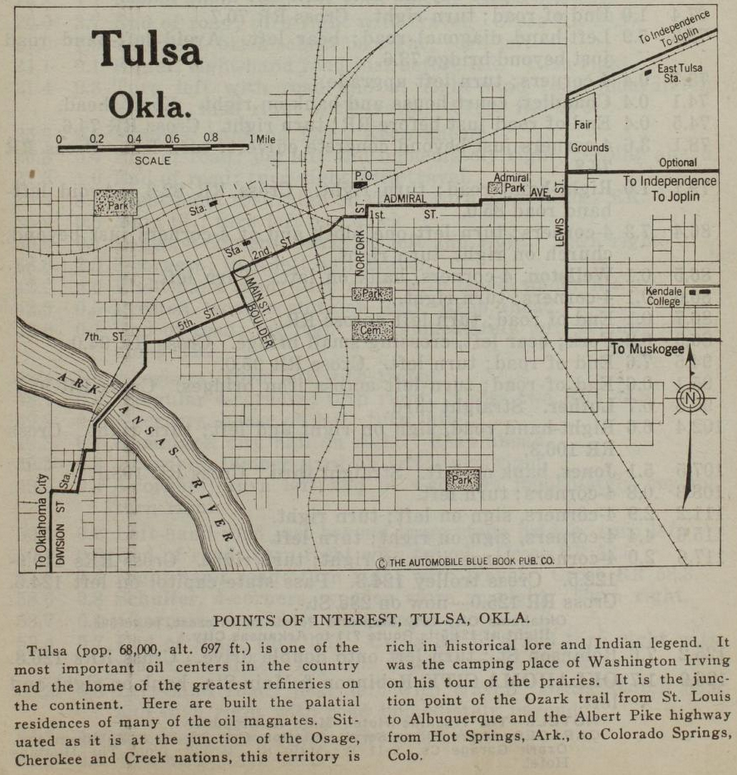
Above is a map of Tulsa from the Official Automobile Blue Book, 1920 edition, Volume 7, p. 779. That link will lead you to the page that begins the Route 901, 126.9 miles from 2nd & Main in Tulsa to Robinson & Main in Oklahoma City.
Only the streets that matter for inter-city motoring are labeled. The reset have to be inferred from old maps.
Heading east, the route goes down 2nd, but bends left at Kenosha onto 1st Place, and then joins 1st Street at Lansing Ave. Two blocks east at Norfolk (misspelled as Norfork) it jogs north to Admiral Blvd, which is today the north service road for I-244. Admiral Blvd jogs north at Utica, and the route reaches Whittier Square at Lewis, where it forks three ways.
- To Independence and Joplin: North on Lewis, east on Dawson Road.
- Optional to Independence and Joplin: North on Lewis, east on Archer Street
- To Muskogee: South on Lewis, east on 11th Street.
The route to Oklahoma City turns south at 2nd and Boulder, west at 5th Street, which merges into 7th west of Houston Avenue. The route turns south onto Maybelle Ave to 11th Street, then diagonally southwest across the Arkansas River bridge -- this part of the route was obliterated for the SW Inner Dispersal Loop interchange. On the west side of the river, the map shows the route heading south on Quanah to 17th, west to a road that follows the east side of the Frisco tracks to 19th, then west on 19th to Union Ave (labeled Division Street on this map). It looks to me like the mapmaker misidentified Union as Division; the 1920 census enumeration district map shows present-day Quanah Ave was West Tulsa's Division Street, before the annexed town's street names were normalized with Tulsa's, so in all likelihood, the route followed Quanah south, then Southwest Boulevard, then Old Sapulpa Road through Oakhurst and Bowden, into Sapulpa on Mission Street and Dewey Ave, then following the old Ozark Trail / Route 66 alignment that parallels and passes under the Frisco tracks.
The trolleys mentioned in the turn-by-turn route instructions are the Tulsa Street Railway (specifically the 5th Street track and the car barns at 5th/7th & Lawton) and the Sapulpa & Interurban, aka Oklahoma Union Traction, with an interurban line crossing the Arkansas River at West Tulsa and city streetcar lines in Sapulpa.
The Tulsa map shows SL&SF (Frisco -- SW to NE), AT&SF (Santa Fe -- SW to N), MKT (Katy - W to SE), and Midland Valley (N to S) railroads, but we can only infer electric interurban lines from mentions in the turn-by-turn text. These railroad stations are shown but Midland Valley is absent:
- MKT at Main between Cameron & Easton.
- SL&SF/ATS&F at Boston south of the Frisco tracks (to be replaced by Union Station)
- West Tulsa station south of what would be 18th & Santa Fe, west of the tracks
- East Tulsa Frisco station at about Delaware Ave, south of the Frisco tracks
Civic amenities shown include Oaklawn Cemetery, Owen Park, Central (Centennial) Park, and Swan Lake Park, but only Admiral Park is named. Kendall College (now University of Tulsa) is misspelled as Kendale, but shown as a couple of buildings east of College Ave between 5th and 7th. The Fair Grounds were between Archer St and the Frisco tracks, from Lewis to about Archer Place. The near northside is hidden beneath the title and scale on the upper left, but deep Greenwood Ave is not hidden. A Post Office is shown on the east side of Madison just north of the Frisco tracks, which seems strange, as that location is isolated from the center of town.
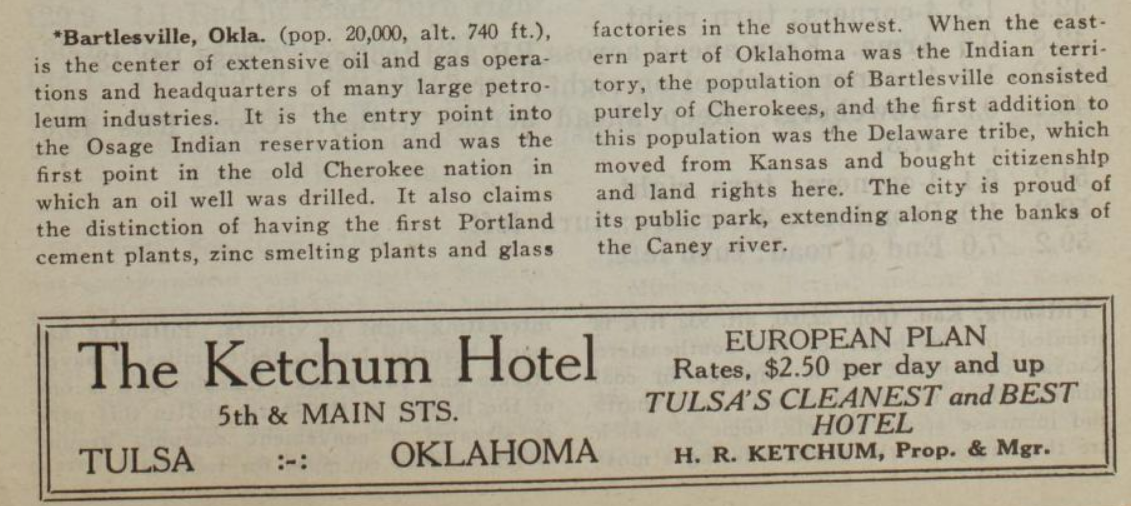
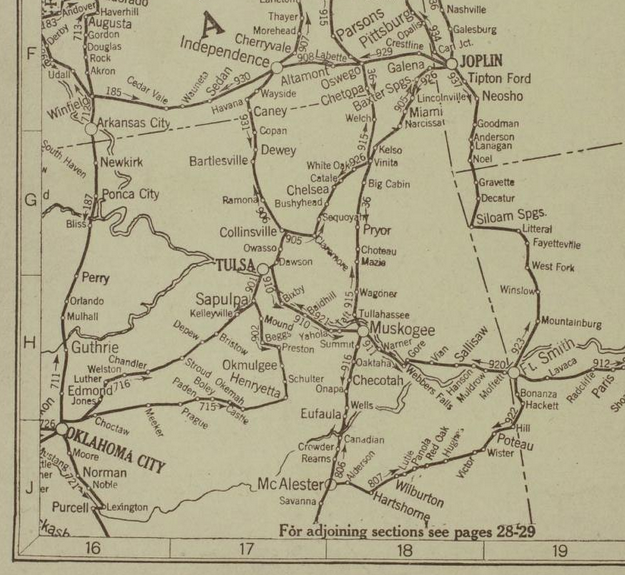
Route 902 is a longer route to Oklahoma City, 168.4 miles via Okmulgee and Henryetta, but it avoids Creek County oilfield traffic. Route 905 takes the Ozark Trail from Tulsa to Joplin, but you go through Owasso, where there was an Ozark Trail monument, to get to Claremore. Route 906 links Tulsa with Bartlesville and Independence, Kansas, paralleling present day US 75. Route 910 goes from Tulsa through Bixby to Muskogee. Each route has its reverse: Route 931 heads back from Independence to Tulsa, concluding with a description of Bartlesville and an ad for the Ketchum Hotel at 5th & Main in Tulsa.
MORE:
Hathi Trust partial collection of Automobile Blue Book volumes
1919 Official Automobile Blue Book, Volume 7, Tulsa map. In this edition, there is no route description for Tulsa to OKC via Stroud, but the road is depicted on the overview map.
"The Official Automobile Blue Book, 1901-1929: Precursor to the American Road Map," John T. Bauer (Department of Sociology, Geography, and Earth Science, University of Nebraska at Kearney), Cartographic Perspectives (Number 62, Winter 2009): Includes a list of all known editions with a breakdown by volume -- very helpful for finding the volume of interest in the Internet Archive and other online libraries.
RELATED:
Automobile Club of Southern California's beautiful strip maps of the National Old Trails Road from Los Angeles to Kansas City, with branches to Denver, Cheyenne, Big Springs, Nebraska, and the Grand Canyon. The stretch from Las Vegas, NM, to Los Angeles was the starting point for US 66 in 1926.
The National Old Trails Road: The great historic highway of America, a brief resume of the principal events connected with the rebuilding of the old Cumberland--now the National old trails road--from Washington and Baltimore to Los Angeles: A 1926 book with lots of interesting history about the evolution of named and numbered highway systems, beginning with the National Road from Cumberland, Maryland, to Vandalia, Illinois. Includes an unsuccessful 1913 congressional proposal detailing 18 numbered highways that would be improved with money from a new federal tobacco tax. Roads 11 and 13 would pass through Muskogee and Oklahoma City, but Tulsa doesn't get a mention. Also much discussion about the proper and constitutional role of the federal government in road building.
Newspapers.com has some amazing content that can help to locate long-lost rural places around Tulsa. I was searching for information about Bethel Union School, later known as Paul Revere School (which I wrote about in conjunction with the centennial of Southern Hills Baptist Church), and I found a legal notice in the November 14, 1946, edition of Tulsa's Farm and Garden newspaper. The notice from the Tulsa County Board of Commissioners announced a bond issue election on December 17, 1946.
The election included two propositions. The first was to borrow $280,000 to build a bridge across the Arkansas River at Jenks. The bond, to be repaid over 20 years, was estimated to cost taxpayers a total of $530,000. The bridge, consisting of 19 pony trusses, was completed in 1948 and still stands, but open to pedestrians only since the new Jenks bridge opened in 1995. On the same ballot was a $1,250,000 bond issue to build a 200-bed county hospital.
The morning after the election the Bartlesville Examiner reported unofficial results with 181 precincts out of 190 reporting: The county hospital was defeated 3,006 (34.6%) to 5,690. The Jenks bridge was approved 7,246 (73.2%) to 2,652. The hospital issue had a significant amount of undervotes: 1202, or 12.1% of people who voted on the bridge question didn't vote on the hospital question. Opposition to the hospital focused on the ongoing cost of operation. A letter to the editor in the Tulsa Tribune (reprinted by the Collinsville News) pointed out that the city already owned the old Morningside Hospital building at 502 N. Boulder and could fit it out for 40 beds. Local government could pay private hospitals to take any additional indigent patients more economically than building and running a new facility.
In the state general election on November 5, 1946, 60,593 Tulsa County ballots were cast for the top two candidates (40,734 for Republican Olney Flynn, 19,859 for Democrat Roy Turner, who won statewide), so the special county bond election a month later and just a week and a day before Christmas had only a sixth of the turnout.
The legal notice for the December election listed all of the 138 precincts in the City of Tulsa on one page and the 52 precincts in the small towns and rural townships on the next, giving the name of the place, the address, the election judge, and the two election clerks. It's remarkable to see how many polling places were set up in homes.
In the list you'll find names of schools long demolished (e.g., Whittier, Jefferson, Dunbar, old BTW, Mingo, Paul Revere, Plainview) or renamed (e.g., Lee, Cleveland, Sequoyah, Roosevelt) and many other forgotten places, like the Rainbow Inn on North Peoria, somewhere between 66th and 126th Streets North.
The 52 rural precincts (all except for those in the towns of Sand Springs and Broken Arrow) are named after civil townships. Some precincts voted at locations lost to time: Dawson Precinct No. 7 voted at the Twin Oaks Filling Station; Frye Precinct No. 1 voted at the home of Mrs. Bessie Wade, 1 mile north of Kramer corner, wherever that was. Willow Springs citizens voted at the White Church, on 129th East Ave south of 121st Street. Some of the Lynn Lane polling places were right on the southeast edge of Tulsa's growth -- Paul Revere School at 51st & Lewis, the Fairgrounds Administration Building, the Tulsa Tennis Club at 28th & Columbia, a house at 1305 S. Memorial, Tulsa Lumber Company at 4112 S. Peoria, Crowell Heights Baptist Church, and Plainview School, shown on a 1914 USGS topographical map as on the north side of 11th Street between Garnett and 129th East Ave.
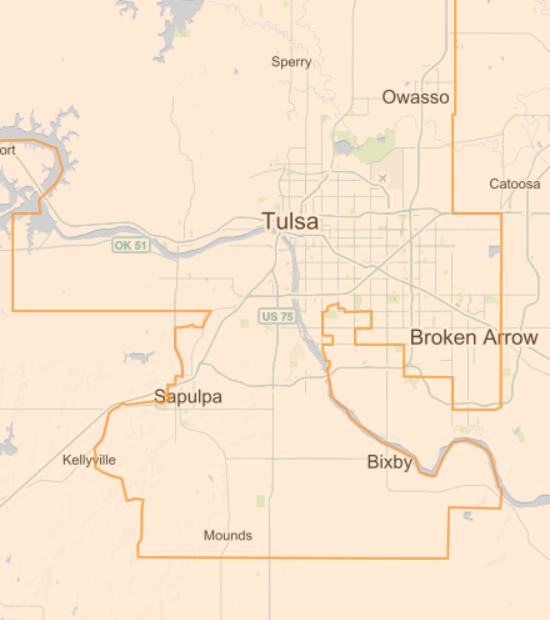
Civil townships are county subdivisions, exclusive of incorporated cities and towns, that had a governmental role for a few years after statehood, but township offices were abolished by all of the counties by the end of the 1930s, although they continued to provide a structure for census districts and voting precincts. Some civil townships share a name with an incorporated municipality (Owasso, Skiatook, Collinsville, Red Fork, Dawson, Bixby, Jenks, Glenpool) and some do not (Wekiwa, Lynn Lane, Fry, Boles, Willow Springs). In Tulsa County, civil township boundaries mainly followed cadastral township boundaries and the Arkansas River.
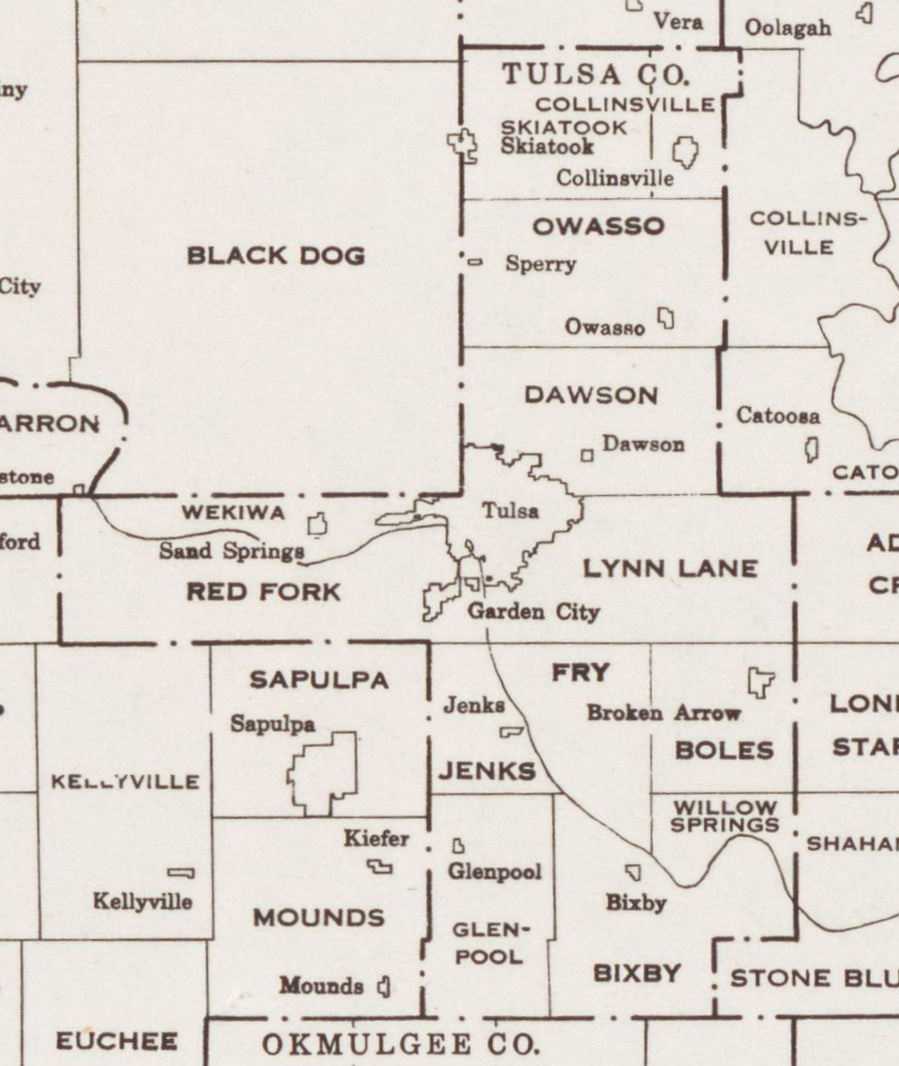 Tulsa County, from "Oklahoma Minor Civil Divisions and Townships," U. S. Census Bureau, 1941
From north to south:
- 186th St N to 126th St N: Skiatook township (W of Mingo); Collinsville township (E of Mingo)
- 126th St N to 66th St N: Owasso township
- 66th St N to Archer St: Dawson township
- Edison St / Archer St to 61st St S: Red Fork township (SW of the river), Wekiwa township (N of river, W of Tulsa), Lynn Lane township (E of river and Tulsa)
- 61st St S to 121st St S: Jenks township (W of river), Fry township (N and E of river, W of Mingo Rd), Boles township (E of Mingo Rd)
- 121st St S to 211th St S: Glenpool township (W of Harvard), Willow Springs township (E of Mingo, N of River), Bixby township (E of Harvard, S of river)
The 1955 Tulsa County Highway Map shows the township names and boundaries in greater detail.
Here are links to Newspapers.com clips of the 1946 Tulsa County precinct list. At some point, I hope to convert the information to a KML file, so it can be displayed as a map overlay.
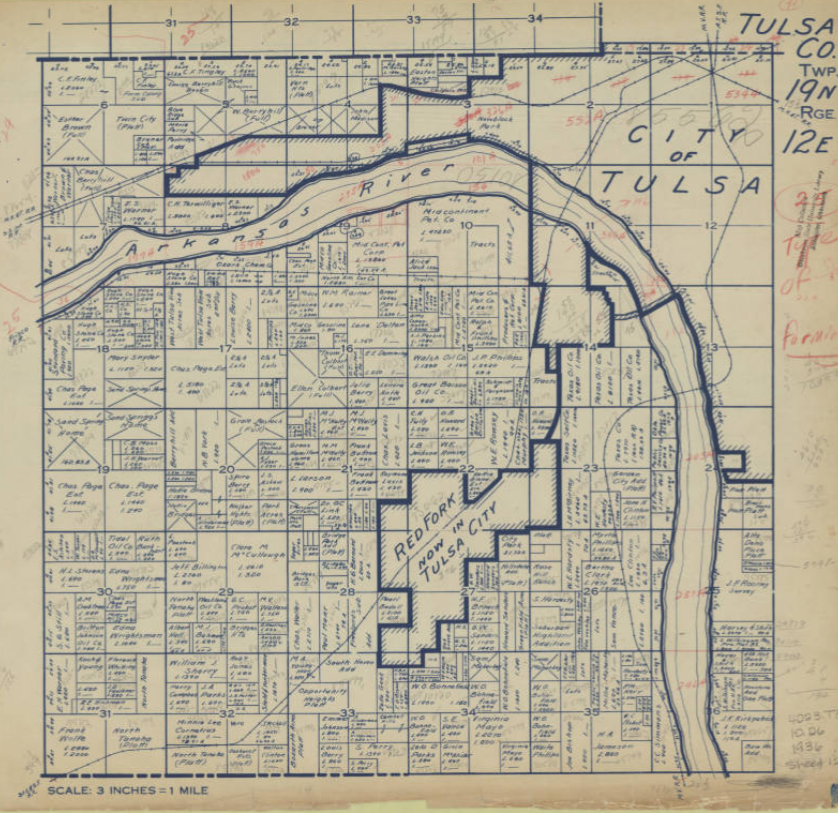
During the Great Depression, the Federal Works Progress Administration (WPA) and Oklahoma Tax Commission (OTC) commissioned a series of maps in 1936 to document land ownership and taxable value. An example of the maps are shown above. Each map covers a Public Land Survey System (PLSS) township (6 miles by 6 miles, divided into 36 square-mile sections). Approximately 2,300 maps cover the entire state.
Municipalities are marked with heavy shaded boundaries; note that Turley, Dawson, and Alsuma are all still independent, while Red Fork had been recently annexed by Tulsa. Tax-exempt properties are marked with a diagonal cross; if the listed owner is a person's name, it's likely a tribal allotment. If taxable, two numbers are listed: L (land value) and I (improvements value). Areas without valuation may be platted subdivisions -- I notice a bunch of them along US 66 in east Tulsa: Glenhaven, Plain View Heights, Radio Heights, Romoland, Lynn Lane Drive, Indian Hills. Interesting to see some prominent names -- Kennedy and Gilcrease in SE Osage County, L. S. Robson and C. S. Avery in what's now east Tulsa, Waite Phillips around Southern Hills, Charles Page and the Sand Springs Home around Sand Springs, Mullendore in Osage and Washington counties.
Some of the Tulsa County maps include part of Osage County. The township, range, and section grid for the Osage Reservation is offset from the rest of the state. It is shifted about 1/4 mile south and 1/2 mile east of the rest of the state.
On maps of T19N townships, there is a heavy-dashed east-west line about 1/8 mile south and parallel to the N edge of the boundary. This is the Creek/Cherokee boundary, which continues west as the Osage/Creek boundary and then the southern boundary of the Cherokee Outlet. East of Lewis Ave in Tulsa this line is Admiral Place, while Archer Ave is the section and township line. You may have noticed that it's farther from Pine to Admiral than from Admiral to 11th Street -- that's why.
Browsing through one of the Osage County maps, covering an area west of Hominy that included Boston Pool, I discovered the location of 200 acres of land that my great-grandfather had owned in 1936, which led me to do more research at the Osage County Clerk's office back in February 2017.
The Tulsa County General Highway Map, Sheet 2, from 1937, shows Tulsa, Sand Springs, Turley, Dawson, and Red Fork, T20N R12E, T19N R11E, T19N R12E, which will provide some context for the WPA maps.
OSU's Oklahoma Digital Map Collection has the entire collection of WPA land maps for Oklahoma online.
BREAKING: After typing up this entry, I just discovered that someone has created a interactive, georeferenced mosaic of all the Oklahoma WPA maps, which also allows you to download maps of interest. This will be useful for locating lost and drowned municipalities, like Keystone, Antwine, Lugert, Centralia, and Hochatown. You can adjust the transparency of the WPA maps, allowing you to overlay it on a present-day satellite view.
Here are the Tulsa County maps, starting at the north end of the county and working west to east in rows.
- T22N R12E (126th St N to 186th St N; 81st West Ave to Peoria, far north Tulsa County and part of Osage County around Skiatook)
- T22N R13E (126th St N to 186th St N; Peoria to Mingo, far north Tulsa County between Skiatook and Collinsville)
- T22N R14E (126th St N to 186th St N; Mingo to 193rd East Ave, far north Tulsa County around Collinsville)
- T21N R12E (66th St N to 126th St N; 81st St West to Peoria; Sperry and vicinity)
- T21N R13E (66th St N to 126th St N; Peoria to Mingo; between Sperry and Owasso)
- T21N R14E (66th St N to 126th St N; Mingo to 193rd East Ave; Owasso and vicinity)
- T20N R12E (Archer to 66th St N; 81st West Ave to Peoria; southeast Osage County, north Tulsa, Turley)
- T20N R13E (Archer to 66th St N; Peoria to Mingo; north Tulsa, Dawson, Mohawk Park, airport)
- T20N R14E (Archer to 66th St N; Mingo to 193rd East Ave; northeast Tulsa)
- T19N R10E (Edison to 61st St S; 273rd West Ave to 177th West Ave; far west Tulsa County)
- T19N R11E (Edison to 61st St S; 177th West Ave to 81st West Ave; Sand Springs, Prattville, and vicinity)
- T19N R12E (Edison to 61st St S; 81st West Ave to Peoria; west Tulsa, Red Fork, Sand Springs, Berryhill; heavy dashed line is the Cherokee/Creek & Osage/Creek boundary)
- T19N R13E (Archer to 61st St S; Peoria to Mingo; midtown Tulsa; heavy dashed line is the Cherokee/Creek boundary at Admiral Place)
- T19N R14E (Archer to 61st St S; Mingo to 193rd East Ave; east Tulsa; heavy dashed line is the Cherokee/Creek boundary at Admiral Place)
- T18N R12E (61st St S to 121 St S; 33rd West Ave to Peoria; southwest Tulsa in Jenks school district, west Jenks)
- T18N R13E (61st St S to 121 St S; Peoria to Mingo; Jenks, south Tulsa, north Bixby)
- T18N R14E (61st St S to 121 St S; Mingo to 193rd East Ave; Broken Arrow, Union and vicinity)
- T17N R12E (121st St S to 181 St S; 33rd West Ave to Peoria; Glenpool and vicinity)
- T17N R13E (121st St S to 181 St S; Peoria to Mingo; Bixby and vicinity)
- T17N R14E (121st St S to 181 St S; Mingo to 193rd East Ave; Wealaka (Leonard) and vicinity, south Broken Arrow)
- T16N R12E (181st St S to 241 St S; 81st West Ave to Peoria; south Tulsa County, north Okmulgee County)
- T16N R13E (181st St S to 241 St S; Peoria to Mingo; south Tulsa County, north Okmulgee County)
- T16N R14E (181st St S to 241 St S; Mingo to 193rd East Ave; south Tulsa County, north Okmulgee County)
Tulsa Mayor GT Bynum IV narrowly avoided a November runoff, winning re-election outright with 51.9% in this first round of City of Tulsa voting. 30-year-old Greg Robinson II, running to Bynum's left, garnered 28.8% of the vote. Ken Reddick, running to Bynum's right, finished third with 13.8%, followed by Ty Walker at 2.8% and Craig Immel at 1.9%, the remaining candidates were below 1%. Turnout was 70,745, with 23.0% voting early. Had another 2,637 voters turned out to vote for candidates other than Bynum, he would have faced a November runoff with Robinson.
I'll be on Talk Radio 1170 KFAQ at 7:30 am Wednesday morning to talk about the results with Pat Campbell.
I had an enjoyable time as a member of a panel of commentators for KJRH's election night coverage, talking about the results and their significance. One of the striking things about the conversation was hearing about the Democratic Party's endorsement of Robinson, setting a precedent that Republicans would do well to follow. The Tulsa County Democratic Party chairman said something about flipping a council seat, which was humorously revealing. We all know that political philosophy matters, even in city government, and that people have party affiliations, despite the lack of a partisan primary. About 15 years ago, I proposed an idea I called multi-partisan elections, in which candidates of all parties would run on the same ballot, but with party labels, which might include words and phrases other than the names of national parties. The label next to a candidate's name might be that of a local coalition formed around local issues.
I started playing around with maps. I have QGIS, an open-source graphical information system suite, precinct and municipal boundary shapefiles from OK Maps, and precinct-by-precinct results from the Oklahoma State Election Board. I used Microsoft Access (I know, I know) to process the election board data before linking it to the precinct map. Here's my first, clumsy effort: A map showing the "swing" between Bynum's June 2016 vote and his vote today. The deepest purple shows precincts where Bynum's share of the vote fell by at least 25 percentage points; darkest green shows where Bynum's share of the vote went up by at least 25 points; in precincts with no color, his 2020 share of the vote was within 5% either side of his 2016 share.
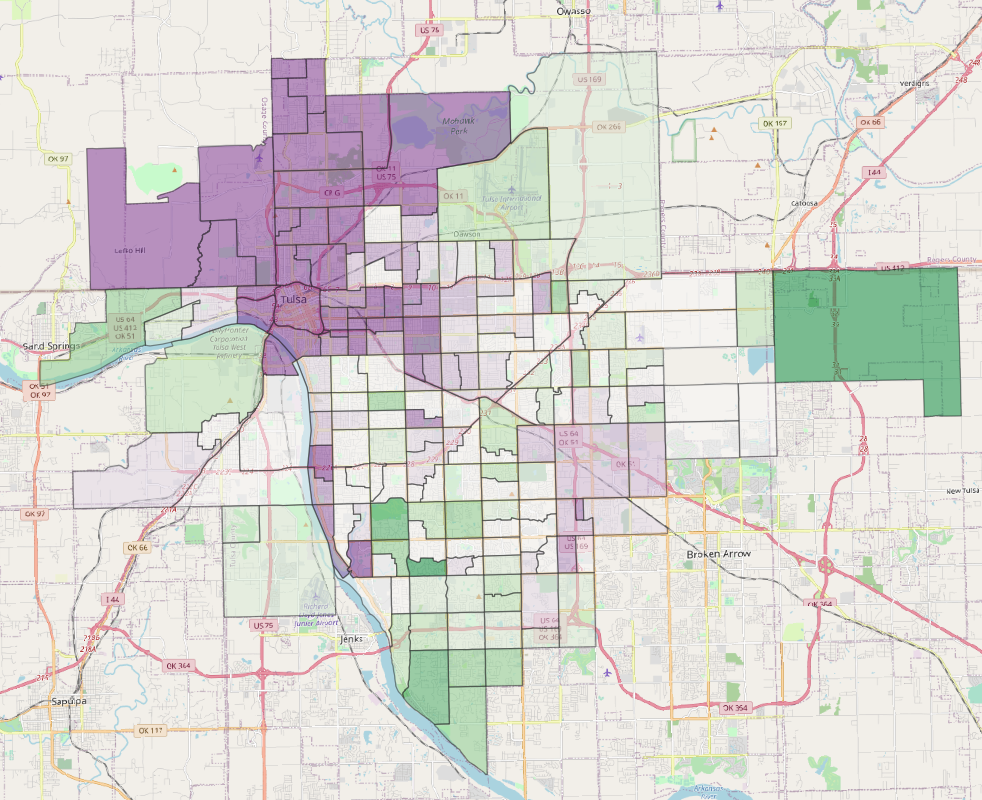
Recall that in 2016, Bynum was effectively the Democratic nominee, the progressive candidate, as no prominent Democrat sought the office. Bynum won with support from Democrats along with those Republicans who were disappointed with Dewey Bartlett Jr's service as mayor. This year, Greg Robinson captured those left-wing voters, while there was no well-funded or well-organized candidate to Bynum's right. Bynum's vote slid most dramatically in north Tulsa and midtown, while his vote improved in south Tulsa.
Now, there are all sorts of problems with the map above. I haven't figured out how to tweak the projection so that a line drawn north through the center of Tulsa points straight up (the shapefiles I'm using are based on Oklahoma as a whole). I haven't figured out how to add a legend, and I didn't bother adding precinct numbers as labels. I haven't done an intersection between the precinct shapefile and the municipal shapefile so that I only show the portions of precincts that are within the city limits. There's no proprietary watermark. All that said, it does give you a picture of how votes shifted, and I hope to put together additional (and more attractive) maps in the near future.
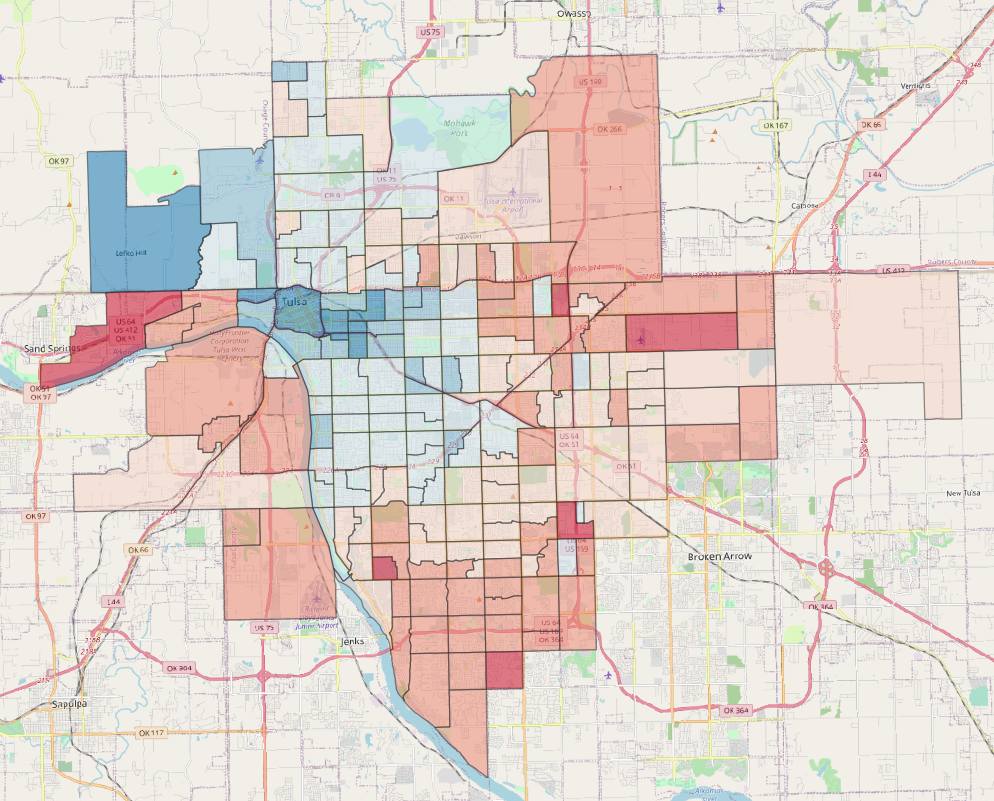
Here's one more: The percentage voting yes or no for Proposition 2, which involved changing a handful of references in the City Charter from he/him to they/them to be "inclusive." Darkest blues are yes > 70%, darkest reds are yes < 30%. Overall, the proposition passed by the narrowest margin of the five on the ballot, with 54.7% support.
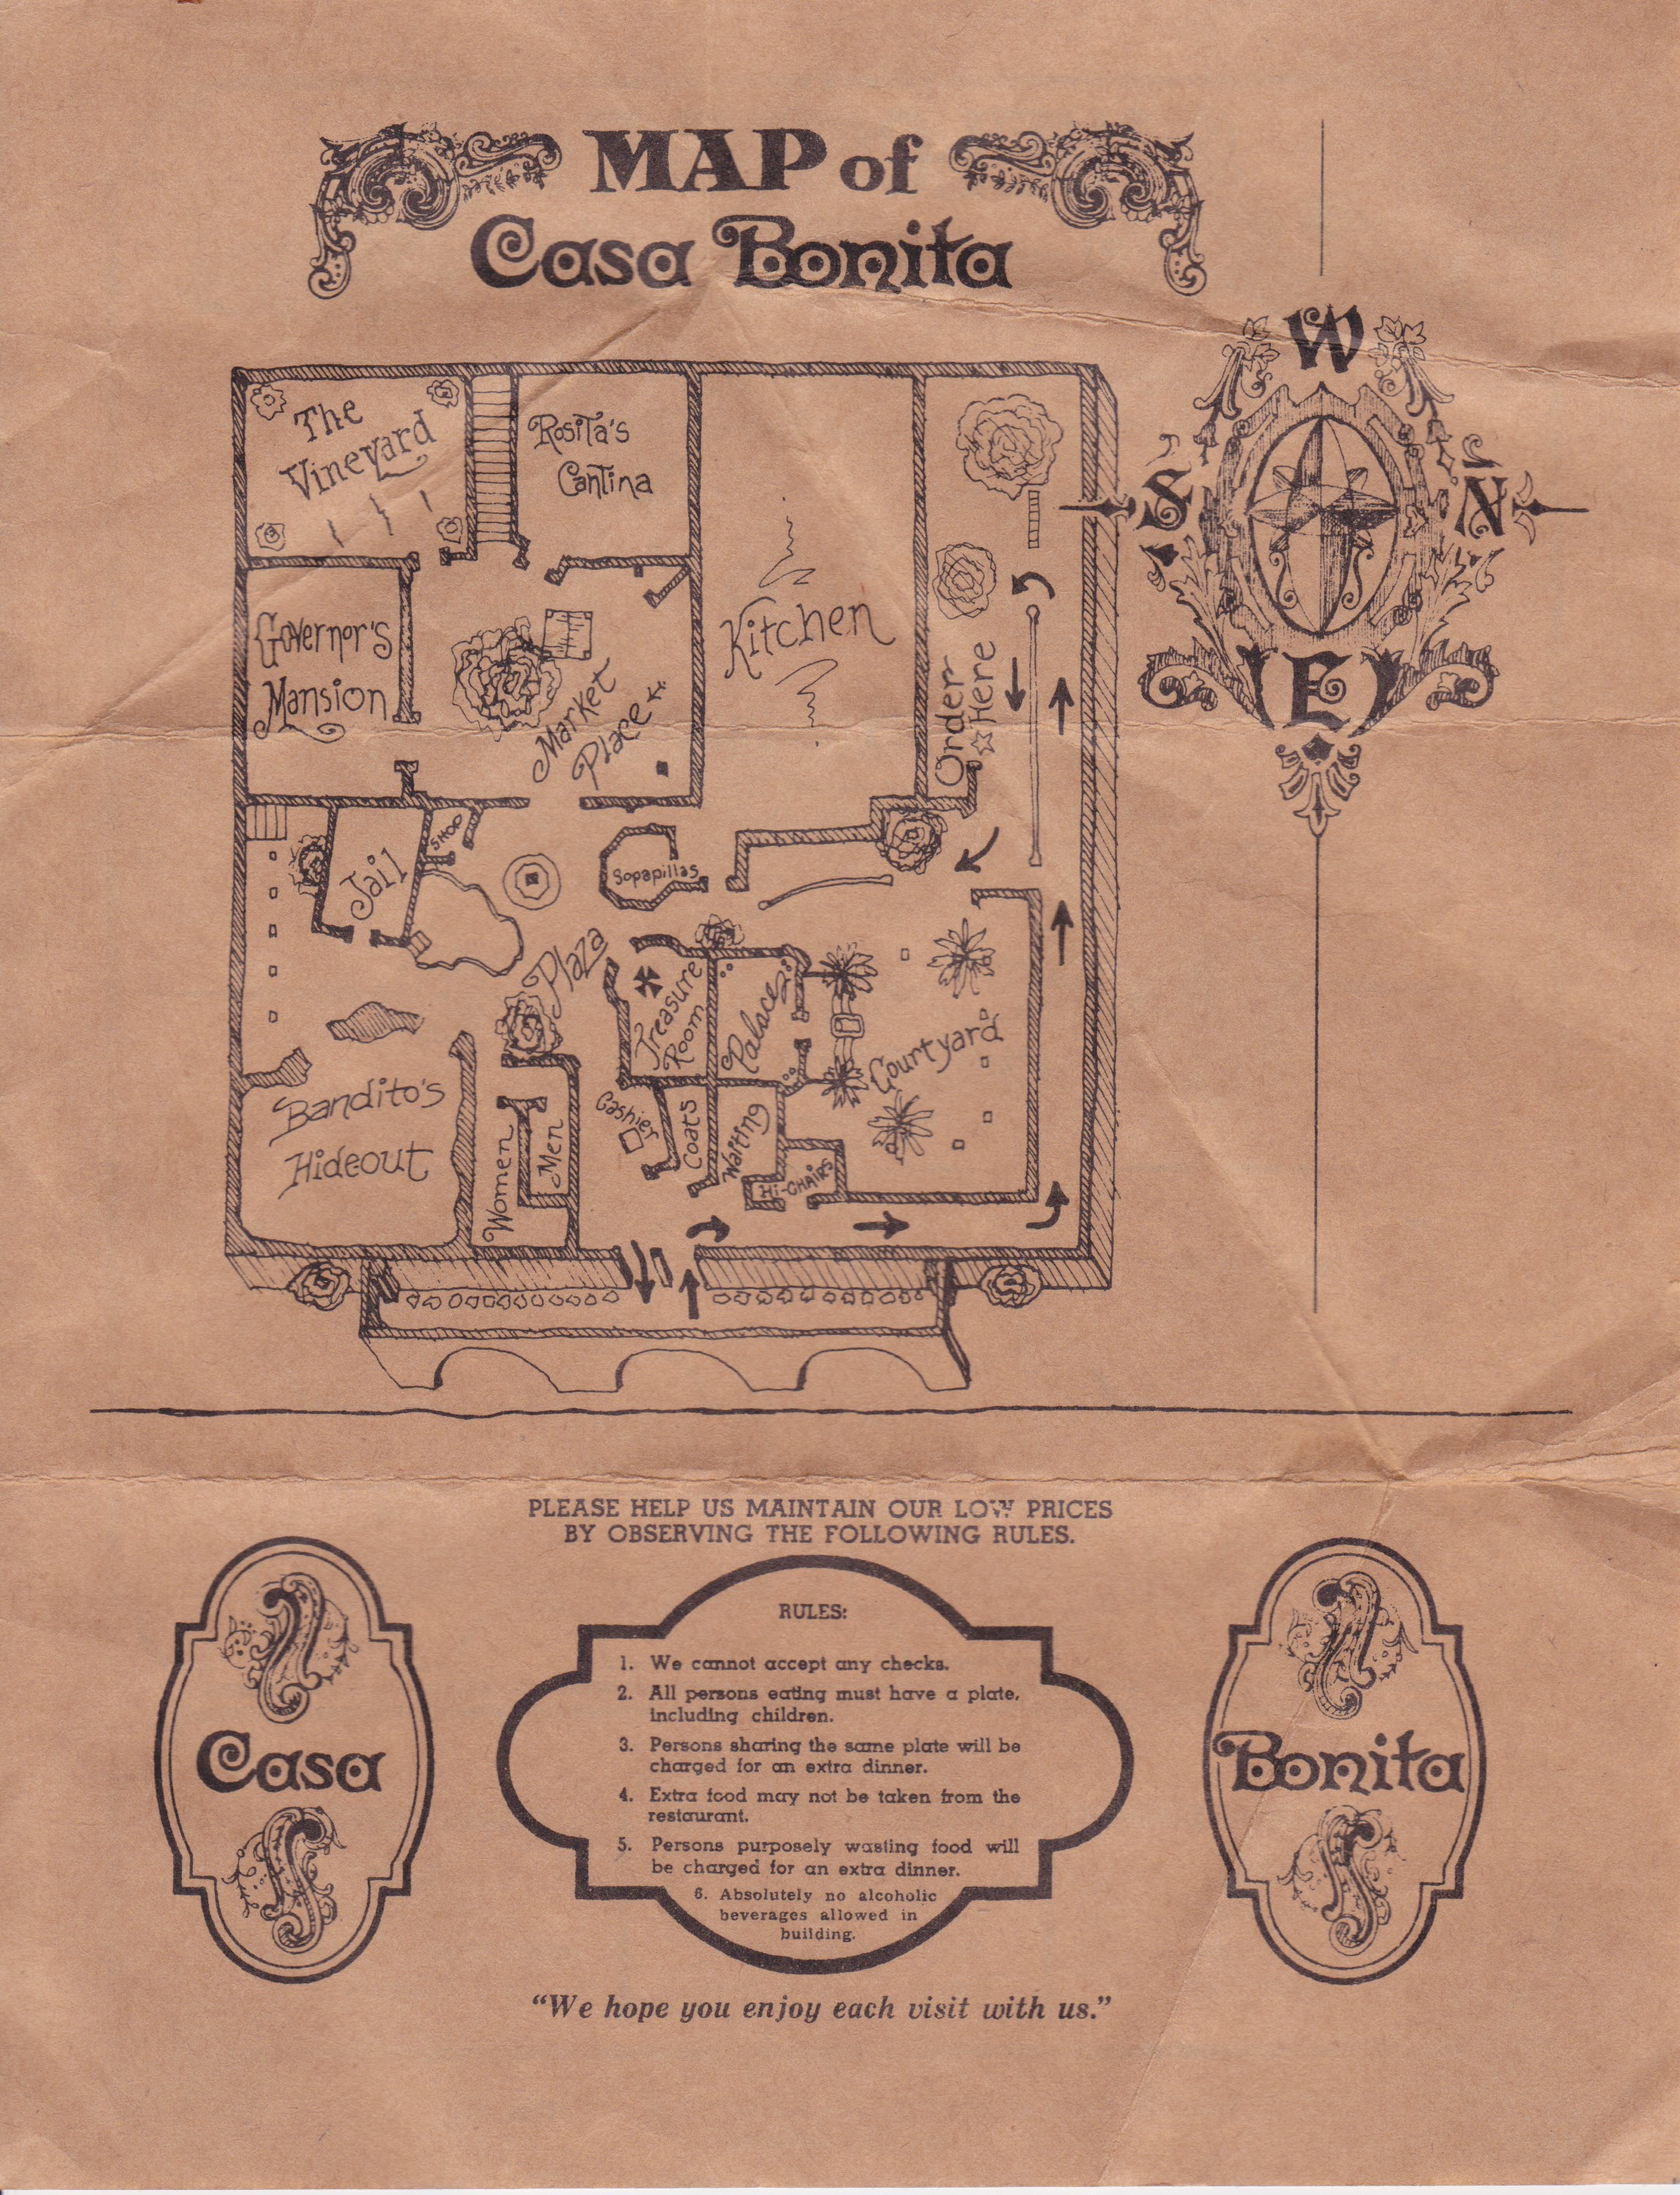
I think it was in the spring of 1971 that Casa Bonita Mexican restaurant opened in Tulsa. I remember a girl in my 2nd grade class bringing a map and menu to school for show and tell and talking about how pretty it was and the sopapillas and the treasure room. We were all envious. Map nerd that I have always been, I was intrigued at the idea of a restaurant that had its own map.
My first visit to Casa Bonita was the night before my first day ever at Holland Hall School; I started in 3rd Grade in September 1971. Our immediate family went with my grandfather and some other extended family members. I suspect I had the Pony Plate: Beans, rice, cheese enchilada, taco, and sopapillas. Most of the adults had the Deluxe Dinner. I remember seeing the adults eating some green mushy stuff which looked disgusting. Then we went back to our house and had strawberry shortcake. Later that night, I got sick to my stomach and threw up. I thought it was because of the juxtaposition of guacamole and strawberry shortcake, but I suspect it was nerves at the thought of a new school and new classmates. (I threw up the night before 5th grade and 9th grade, too.)
Going through some old papers I came across the map from that first visit. You'll notice that this was before Casa Bonita's expansion to the south, when they added an arcade and the Acapulco Room.
Here's the map (click for full size):
And here's the menu:

Another interesting map find. This Rand McNally Vest Pocket Map of Oklahoma from 1910 appears to be an earlier map, overprinted in red to show numbers indexed to railway names and parcel companies and to show electric railway lines.
The U. S. Post Office did not deliver parcels until January 1, 1913. Prior to that date, the parcel delivery business was handled by a cartel of companies. The index to this map lists four: Wells Fargo & Co.'s Express, American Express, Pacific Express, and United States Express. Each railroad was tied with a specific express company -- Santa Fe and Wells Fargo, Frisco and United States Express, Katy and American Express, etc. Presumably, you'd need to know which town was served by which express company in order to send a parcel. This U. S. Postal Service history commemorating 100 years of parcel post explains that the lack of competition that brought demands for the government to enter the market.
The map of electric rail lines shows interurban lines linking Tulsa, Sapulpa, and Kiefer (now the de-electrified Tulsa Sapulpa Union Railway); McAlester, Krebs, Haileyville, and Hartshorne (the Choctaw Railway and Lighting Co.); Shawnee and Tecumseh; Capitol Hill (south Oklahoma City), Oklahoma City, and Edmond, with a broken line indicating expansion plans to Guthrie.
Linking the Shawnee and Sapulpa interurbans is a broken double line indicating a proposed electric railway connection passing through Prague in Lincoln County, Paden in Okfuskee County, Newby and Tabor in Creek County. Lest that seem like too long a route for trains running on overhead wires, the Sacramento Northern Railroad, an electric interurban line, connected Chico, Sacramento, and Oakland, 183 miles from end to end.
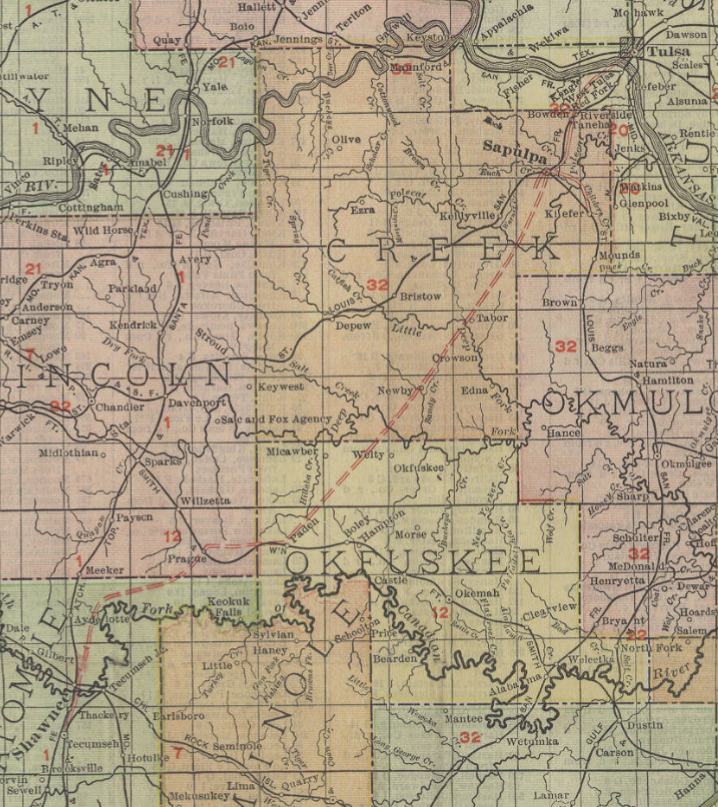
Sapulpa to Shawnee is one of many long-distance interurban proposals that never came to fruition. The December 16, 1910, edition of the Canadian Valley News, published in the town of Jones in Oklahoma County, reported that work had begun on the Tulsa to Sapulpa interurban line. "This is the line that will build on west to Oklahoma City, passing through Jones." The November 10, 1911, edition of the same paper reports an expected consolidation of the Tulsa-Okmulgee and Sapulpa interurban lines. I had never heard that Okmulgee had any sort of electric railway, much less a connection to Tulsa.
Another surprise on the map is an electric railway line beginning at Clinton, then extending west and north about 20 miles, into an area that lacks other railways.
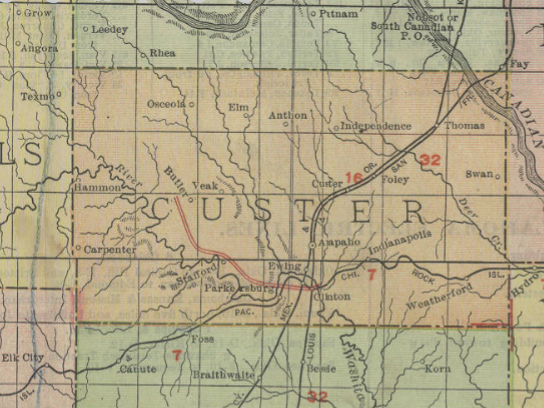
This may be all that was completed of a proposal reported in the July 28, 1906, Trade Bulletin:
A WESTERN OKLAHOMA INTERURBAN.The Clinton, Cheyenne & Canadian Interurban Railway Co. is the name of a new company, recently organized at Cheyenne and incorporated with a capital stock of $1,000,000. The officers and directors are C. G. Gilkerson, president; L. L. Collins, vice president; R. V. Converse, secretary-treasurer; L. W. Pate and W. T. Bowers, all of Cheyenne. The proposed road will be built from Clinton, Custer county, to Cheyenne, Roger Mills county, and then to Canadian. texas. A branch line will be constructed from Cheyenne to Mangum. The projected road will open up entirely new country not now reached by any steam or electric line and should it be successfully pushed to completion, will be of great value to the farmers and merchants of this section and also a profitable investment for the stockholders.
The same page mentions plans from an electric interurban line from Ardmore to Lawton, one from Newkirk to Oklahoma City via Peckham, Blackwell, Tonkawa, Billings, Perry, Guthrie, and Edmond; and Muskogee as the "center of a great interurban electric system."
Subsequent maps don't show proposed routes, except that the 1911 Rand McNally map of Oklahoma and 1912 Rand McNally map of Oklahoma have a dotted line from Sapulpa to Tulsa.
The 1913 Rand McNally map deletes the Clinton electric line and shows instead a steam railway on that route, the Clinton, Oklahoma, and Western, from Clinton to Strong City in Roger Mills County, via Butler and Hammon. Later maps show it continuing on to Cheyenne and the state line. The Oklahoma City interurban connects north to Edmond, south to Moore, and west to El Reno. The Sapulpa system has a branch to Kiefer and another south-southwest of town. There is a Muskogee-Fort Gibson line, a Bartlesville-Dewey line, a line from Miami north to Hattenville (Geneva post office), and the aforementioned McAlester-Hartshorne and Shawnee-Tecumseh lines. The 1913 map also shows the transfer of a six-mile-wide band of southern Kiowa County to Tillman County and 45 square miles from Wagoner to Tulsa County.
The 1928 Rand McNally map of Oklahoma may show the peak of electric rail in the state. Sapulpa to Tulsa interurban is complete, and the Kiefer branch has been extended to Mounds. The Sand Springs Railway is listed as a steam and electric railroad. The Oklahoma City system now reaches Guthrie and Norman. Muskogee has a second branch to East Muskogee. There are new lines connecting Nowata and Coffeyville in the northeast and Lawton and Ft. Sill in the southeast. The McAlester to Hartshorne line still exists, but the Bartlesville and Shawnee interurbans are gone.
MORE: Oklahoma rail historian Cecil Cloud writes that the Shawnee-Sapulpa proposal "may have been part of a much more comprehensive scheme that was being floated at that time":
Those were the peak years of the interurban mania, and paper roads were being promoted across the state. One that was being boomed in Sapulpa would have connected almost every major town in Northeastern Oklahoma, but it was never completed.Tabor was just north of what would become Slick and northwest of Beggs.. Paden to Newby to Tabor to Sapulpa would have made a connection from the Fort Smith and Western at Paden to the Frisco at Sapulpa. It would also have to cross both the Deep Fork and Little Deep Fork, as well as some rugged terrain southwest of Sapulpa.
The Oklahoma and Southwestern Railway, as well as the town of Slick,did not come into being until after 1920, but the proposed line would have crossed the O&SW slightly north of the Slick depot.
During the interurban era, the O&SW was advanced, along with the Midland Valley, as a potential merger partner for the Sapulpa and Interurban. Local and regional sources indicate that the Sapulpa and Interurban line south of Kiefer was taken up to build the line to Tulsa. Some grading may have been completed southwest of Mounds, in the direction of the proposed junction with the O&SW at Tolon. According to an old Frisco timetable, Tolon was between Edna and Nuyaka. There is a 1920s vintage OCC map in the town museum at Davis which shows a proposed extension of the Sapulpa and Interurban south from Mounds and almost to Okmulgee--but this was never built. The same map shows the Midland Valley branch from Jenks, through Perryman and Watkins, though Glenpool and on to a junction with the Sapulpa and Interurban at Kiefer.
I have a digital copy of the 1908 Rand Oklahoma Map, and this line does not show on it, nor does it show on the OCC 1909 Railroads of Oklahoma map. My 1908 map was also overstamped with the names of express companies and their associated railroads, as this was before the merger which created the Railway Express Agency.
The 1910s mania for interurbans, with new plans announced before any attempt to assess the geographical or financial feasibility of the proposals, brings to mind the airline mania of the 1990s, when airline boosters convinced city and state governments to subsidize new airlines with the promise of non-stop flights to the coast, which never materialized.
On the back wall of the Meers Store, overlooking a dining table laminated with a poster of Lucille Ball singing the praises of Royal Crown Cola, is a framed map of Oklahoma, a page from an old Geo. F. Cram atlas, circa 1910.
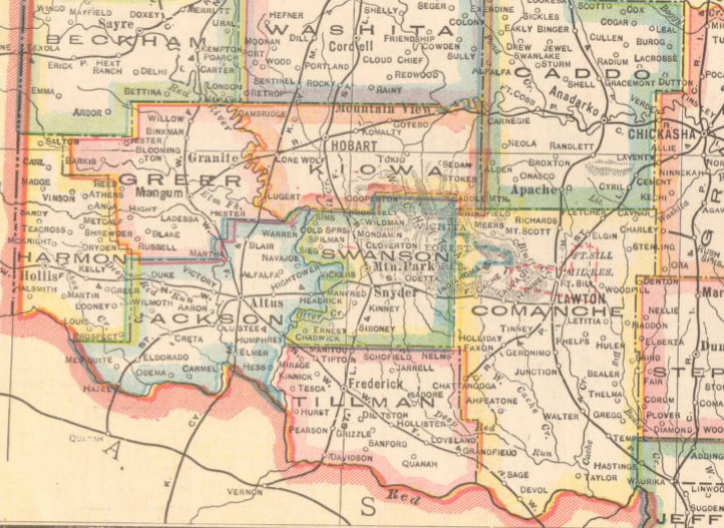
The 1910 map shows several differences with the final form of Oklahoma's county map. Tulsa County looks even more like a collection of unwanted scraps, missing chunks at its southeastern and northeastern corners -- Collinsville, and everything northeast of 126th Street North and Mingo, are in Rogers County; everything southeast of 121st Street and Mingo are in Wagoner County. One of the post-statehood counties is there -- Harmon County (born June 2, 1909) has been carved out Greer County -- but Comanche County's southern boundary is the Red River; Cotton County would not be created until 1912. The map reflects the June 11, 1910, election that moved the state capitol from Guthrie to Oklahoma City.
And yet this map shows 77 counties. In southwestern Oklahoma, between Comanche, Tillman, Kiowa, and Jackson Counties, there is Swanson County, with its seat at Mountain Park. Swanson County included the towns of Snyder, Roosevelt, Cooperton, formerly in Kiowa County, and Indianola, formerly in Comanche County.
You can view a badly-registered four-color version of the Cram 1910 map of Oklahoma in Oklahoma State University's online map collection; the version at the Meers is yellow and black only. Swanson County also appears in Rand McNally's 1911 map of Oklahoma.
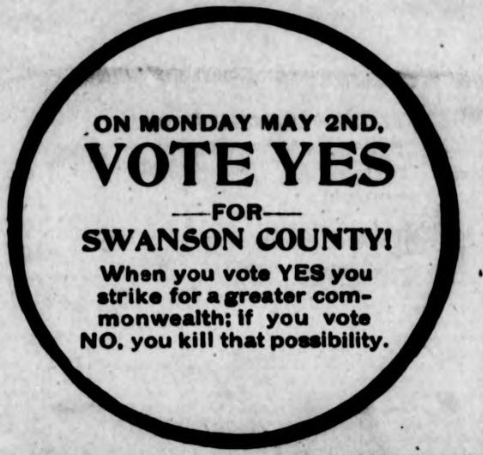
Swanson County's existence was brief, tumultuous, and ultimately found to be illegal. A referendum to carve the county out of southern Kiowa County and the westernmost 8-mile-wide band of Comanche County passed on May 2, 1910, with over 60% of the vote (1990 for to 1220 against), but failed to meet that threshold in the section of Comanche County to be included in the new jurisdiction. The portion of Kiowa County voted 1910 to 907 in favor of the new county, while the Comanche County portion voted against by 80 to 223. Gov. Charles Haskell proclaimed the new county's existence on August 13 and designated Mountain Park as the county seat, but the citizens of Snyder, at an important rail crossroads, objected. According to the Encyclopedia of Oklahoma History and Culture:
Competition arose between Snyder and Mountain Park for the seat. Snyder citizens claimed that their town was better suited because Mountain Park lacked a water system, fire protection, and office space for county officials. After dark on September 5, 1910, Snyder citizens removed the records from Mountain Park when a rainstorm soaked the documents housed there. In retaliation, Mountain Park men invaded county officials' homes and arrested the officials at gunpoint. Wyatt L. Staples, who worked for one of the county commissioners, was killed.
The Swanson County Democrat published letters to the county commissioners, one from County Judge Frank P. Cease and one signed by the treasurer, surveyor, registrar of deeds, court clerk, county clerk, district clerk, and superintendent. Judge Cease stated of the county courthouse:
At the present time the building is not in a habitable condition for the safe preserving of the records and the property of the county. It is impossible to remove the filing and record cases to any safe place where they would not be exposed to fire or being carried away, and the roof of the building is in bad condition, and some of the property has already been damaged by reason of the bad condition of the building.
The other county officials complained that Mountain Park "is without sufficient hotel and eating house accomodations to meet the demands of your petitioners [the county officials] or the public at large and that there are no suitable residence or sleeping accomodations for the use of your petitioners and their familes." A news story on the same page reported that officials were forced to stay in Snyder and commute every day to Mountain Park, a distance of four miles each way. The only official that didn't move his office to Snyder was the county sheriff.
A headline in the September 15, 1910, Swanson County Democrat trumpeted:
Snyder Remains County Seat
GOV. HASKELL REFUSES TO ACT
County Officers Remain at Snyder--County Court Held Monday and Tuesday--All Legal Business Transacted Here--No Riots--No Trouble--Just a Lot of Guano Eltoro in the Oklahoman Furnished by L. E. Cahill and E. J. Giddings Attorneys for Mt. Park
Comanche County sued to have the creation of Swanson County nullified. The Supreme Court upheld the district court's decision, citing the language of Article 17, Section 4, of the Oklahoma Constitution: "Provided, that when the territory is to be transferred from an existing county to either a new or an existing county, there must be sixty per centum of the vote cast in such particular territory in favor of the transfer."
Swanson County might have succeeded had it not attempted to include that unwilling chunk of Comanche County. It would have met the requirement for 400 square miles of land, but perhaps it would have fallen short of the required 15,000 population or $2.5 million land valuation.
With the Oklahoma Supreme Court ruling, Swanson County ceased to exist, and the count of Oklahoma counties reverted to 76. Nevertheless, the territory once claimed by Swanson County would continue to elect a representative to the State House for the remainder of the decade, as it existed during the 1911 legislative apportionment, and the Kiowa County representative would elected only by those voters in the remaining part of Kiowa County, according to an Attorney General's opinion reported in the April 11, 1912, edition of the Kiowa County News.
It's easy to understand why residents of southern Kiowa County would want a county seat closer to home. Manitou was, at that time, on the border between Kiowa County and Tillman County. Someone living on the Kiowa County side of Manitou would be 36 miles as the crow flies from the county seat of Hobart, but the Tillman County side was only about 7 miles from the county courthouse in Frederick.
An item in the September 1, 1910, Swanson County Democrat describes "the new county craze which has seized southwestern Oklahoma," mentioning a new effort to form a county out of southern Caddo and northern Comanche County centered on the town of Apache.
On January 30, 1909, a proposal to create Park County, with the same boundaries that would be proposed a year later for Swanson County had fallen short of the 60% threshold by 18 votes, just a month after the southernmost township of Kiowa County had voted to join Tillman County, a decision that still needed to be ratified by the voters of Tillman County.
Not long after the end of Swanson County, a smaller swath of southern Kiowa County succeeded in getting itself transferred to Tillman County, and in 1912, the southern section of Comanche County seceded to form Cotton County, bringing the roll of counties back to 77. There would be a few more boundary adjustments over the coming years, but the end of county creation had come to a close.
On the Map Scans Facebook group, someone posted a link to the Internet Archive's copy of the 1980 State Farm Road Atlas, which was a rebranded Rand McNally Road Atlas. That got me wondering about finding earlier editions, and I did a search for items published by Rand McNally. The results were much broader than I expected. I knew that the company had published children's books -- I had several growing up -- but I was amazed by the number of other topics included. Before the days of automobile travel, there were "Handy Guides" to major American cities and for now-legendary World's Fairs in St. Louis, Buffalo, and Chicago. There is even some long-obsolete Rand McNally software available on the archive.
Here's a short list of interesting items I found:
- 1893: Handbook of the World's Columbian Exposition: The great World's Fair in Chicago to commemorate the 400 anniversary of Columbus's voyage of discovery. Midway Plaisance, White City, and the lakefront are all legacies of this fair. This book includes maps of the grounds and of major exhibition buildings, with descriptions of what you'd find in each. Australia didn't yet exist, but New South Wales had a pavilion. Oklahoma shared a Joint Territorial building with New Mexico and Arizona.
- 1893: Diagrams of World's Fair Buildings showing Location of Exhibits: Maps and building plans (but no description) from the Chicago World's Columbian Exposition
- 1895: Chicago City Railway Directory and Street Number Guide: "Accurately locating any given number of any street or avenue, and showing the street car line most convenient for reaching it. Also giving the route of every car line, with distinguishing colors of cars and lights; night line time tables, etc."
- 1898: The Washington Post Standard War Atlas: The war being the Spanish-American War.
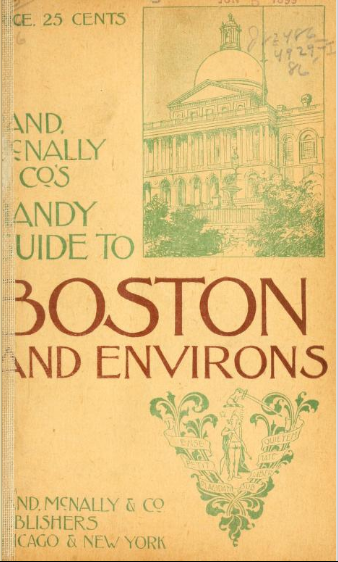
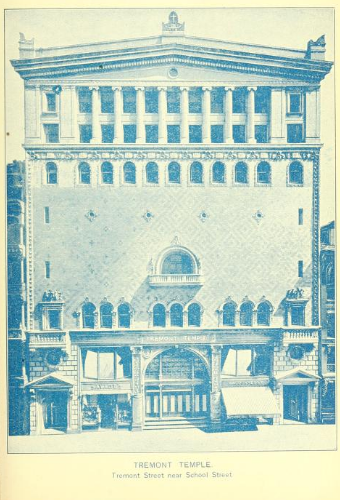
- 1899: Handy Guide to Boston and Environs: Descripitions of streetcar routes and the recently opened Tremont Street subway, photos of important buildings, including my church home-away-from home, Tremont Temple, which opened its doors for public lectures between Sundays. The current building was only six years old at the time, having been rebuilt after a fire.
- 1904: The Rand-McNally economizer; a guide to the World's fair, St. Louis, 1904: The guide tells the reader how best to spend six days at the fair, winding up in a reproduction of old Jerusalem. Oklahoma has its own building now: "A composite Corinthian effect has been admirably planned and carried out by the architect [A. J. Miller of Oklahoma City] of this building. Large porches with wide ornamental arcades surround the front of both floors, and a view of the immense reception hall may be obtained from the wide gallery on the second floor." The Philippine village rates four pages of description and a photo. There is an exhaustive catalog of artworks on display and of the items from Queen Victoria's Jubilee Presents -- items received from the far reaches of the Empire in honor of her 50th and 60th anniversaries on the throne.
- 1914: United States Colonies and Dependencies Illustrated by William Dickson Boyce: A 600 page book describing our colonies (Alaska, Hawaiian Islands, Philippine Islands, Porto Rico, the Panama Canal Zone and Republic of Panama) and our dependencies (Cuba, Haiti, Dominican Republic).
- 1914: Atlas of the European Conflict: "containing detailed maps of the nations, pertinent statistics of the contending powers, analysis of conditions leading up to the present struggle." Includes a very nice detailed map of the German Empire with its component kingdoms and duchies.
- 1915: Rand McNally official auto trails map of the United States: Before the numbered U. S. highway system of 1926 there were named highways marked on telephone poles: Jefferson Highway, Ozark Trail, Dixie Highway, Old Spanish Trail, and the famed Lincoln Highway.
- 1916: Washington guide to the city and environs: Streetcar routes, ads for grand hotels, descriptions and photos of monuments and prominent buildings (including the then-new Post Office, now a Trump hotel). There is a detailed map and guide to the Library of Congress, including photographs and descriptions of its murals and inscriptions. The Corcoran Gallery, Smithsonian Institution, White House, and Capitol also enjoy extensive description. There is even a section to help you navigate the etiquette if you happen to attend a dinner with the President. At the back you'll find patent medicine ads, and information on electric railway transportation to the Great Falls of the Potomac. You could have gotten a pretty decent civics education from this book, which not only shows you the major federal office buildings, but explains what functions are performed within.
- 1918: Ukraine: The Land and Its People: By Prof. Stephen Rudnitsky of the University of Lemberg, a city later known as Lwow, Poland, and now Lviv, Ukraine. Published by the Ukrainian Alliance of America. Written in Ukrainian and translated into German and then from German to English. "The reader is respectfully requested to note that the few unpleasant references to Russia are of course meant to apply to the Russia of the Czars, as the book was written during the Czarist regime."
- 1919: Summary of the Treaty of Peace: Map showing the new, post-World War I boundaries of Europe. Jugo-Slavia, Poland, and Czechoslovakia exist, and Germany has lost territory to France, Poland, and Denmark, but the Baltic States have yet to be created. Turkey's partitioning is curious.
- 1919: What Calvinism Has Done for America by John Clover Monsma: This is worth further exploration. The author attempts to show the roots of America's greatness in the doctrines and habits of Calvinism, which he boils down to the core idea of God's sovereignty and traces two centuries before Calvin to the English theologians William of Occam and Thomas Bradwardine.
- 1921: Australia and New Zealand Illustrated by William Dickinson Boyce: Hopefully there's another version out there; this scan lacks all the illustrations.
- 1960: The Elves and the Shoemaker: The Brothers Grimm tale, illustrated by Esther Friend.
- 1973: Rand McNally Road Atlas and Travel Guide: This is a smaller format atlas, with each state on a single page, and only major highways shown.
- 1980: State Farm Road Atlas. United States / Mexico / Canada: A standard Rand McNally Atlas of the period with State Farm insurance ads on the outer and inside covers.
The older books are public domain; newer books are available for 14-day loan, if you have a free Internet Archive account.
Mapping Tulsa, a diverse collection of historical maps illustrating Tulsa's history and culture, is on display at the Henry Zarrow Center gallery, at the southwest corner of Brady Street and Cincinnati Avenue in Tulsa's Bob Wills Arts District. The gallery is open noon to 6 pm on Thursdays, Fridays, and Saturdays, and the Mapping Tulsa exhibit runs through June 30, 2018.
I went to see it last Saturday with my youngest son, who has inherited his dad's fascination with maps. While many of the maps were familiar from online collections, there were a few I had never seen before, and it was fun to be able to look at them together in a large format and discuss the interesting details we found. Here's a list in roughly chronological order, with a few of those details.
- 1804, Tanner-Arrowsmith Map of Louisiana
- 1830-1840, Routes of Emigrating Indians: 1932 map showing Trail of Tears routes from the southeastern US to Indian Territory, compiled by Grant Foreman and traced by George Bystrom
- 1866, Indian Territory: Highlights effect of post-Civil War treaties with the tribes that fought alongside the Confederacy.
- 1890, Map of Indian Territory and Oklahoma: Showing railroads, trails, tribal boundaries, treaty dates. Oklahoma is shown as everything west of the Five Tribes territories, except that the Panhandle is not included, and labeled as "Public Lands."
- 1898, USGS Fractional Survey Township Plat, T19N, R12E: Covers 81st West Ave to Peoria, Osage County Line to 61st Street. Shows the newly incorporated boundaries of Tulsa, parcels and acreages, slopes, wooded areas, cultivated fields, and creeks that have long been channeled into storm sewers.
- 1901, Map Showing Progress of Allotment in Creek Nation : Shows division into townships and sections, shaded lands that had been allotted already, railroads, townsites, agencies, and tribal facilities.
- 1901, Tulsa Town Site Map: 1944 republication in honor of Tulsa's incorporators and in memory of surveyor Gus Patton. Shows original townsite (654.48 acres) and municipal limits (1440 acres, or 2.25 square miles) at incorporation.
- Circa 1901, Section 9 of T15N, R18E: "SECTION DIAGRAM: Showing irregular form of present land holdings of Creek citizens as surveyed and platted by the Commission to the Five Civilized Tribes preparatory to allotment." Fields on the diagram belong to people with the last name Rentie, Spaulding, Van, Mackey, and Sango. Fences, buildings, roads, and timbered areas are plotted on a grid of 0.4 acre squares (132 feet by 132 feet, or two chains by two chains).
- 1905, State of Sequoyah: Shows proposed county boundaries on a 1902 USGS base map.
- Civic Center / Union Station proposal, probably from the 1910s: Bird's eye-view of a proposed Beaux Arts Civic Center, in the fashion of Chicago's Midway or the National Mall, which would have occupied the blocks between Archer and Cameron, Main and Cincinnati, with a Union Station north of Cameron Street, and the rail tracks running approximately where the old MK&T tracks were, what would have been Davenport Street. The Civic Center would have included a public library, federal, county, and municipal buildings, municipal auditorium, and hall of records surrounding a plaza with a tall obelisk atop a museum or memorial.
- 1918, Fowler and Kelly bird's eye map of Tulsa
- 1920, Sanborn Fire Insurance Map, Tulsa, Sheet 9: Shows the heart of Tulsa's African-American district, Greenwood and Frankfort Avenues from Archer to Easton Streets, prior to its burning by a white mob in 1921. The color image highlights the pasted segments, used to update the map to show recent construction.
- 1920, Sanborn Fire Insurance Map, Tulsa, Sheet 6: Shows Archer to the MK&T tracks, Cheyenne to Main. This is an actual page from the atlas, under glass. Not only can you easily see the pasted segments with recent construction, but if you look carefully, you can see what was there before, showing through the new layer.
- 1921, Art Work of Oklahoma's Oil Cities: On display are photos of the Arkansas River and the University of Tulsa campus.
- Before 1924, Spavinaw water system: A mosaic of three USGS quadrangle maps (Hominy, Claremore, Pryor), with the route of the water pipeline drawn over it, along with the High Pressure Reservoir on Reservoir Hill, Mohawk Reservoir, and the Tiawah Tunnel. What's fascinating is that the Hominy and Claremore quadrangles are from 1916, so they show the influence of quarter-section allotment on the road network. The Pryor quadrangle is from 1901; its roads follow the terrain. Many long-gone rural schools are shown on this map.
- 1928, Tulsa and Northeast Oklahoma promotional map, Tulsa Chamber of Commerce: Shows Tulsa at the intersection of "Three Great Highways" (US 64, US 66, US 75), major city streets and highways, roads of northeastern Oklahoma, and articles touting the region's virtues.
- 1936, WPA map of land ownership, Tulsa County, T19N, R13E: This map, one of a statewide series documenting owners and property values during the Great Depression, shows the 6 mile by 6 mile township between Peoria Avenue and Mingo Roads, Archer and 61st Streets. There are a number of well known Tulsa names on the map: Waite Phillips, Rachel Perryman, P. J. Hurley, Francis A. Rooney. Tulsa County already owned the land that would become LaFortune Park, and a Catholic convent owned 80 acres NW of 51st and Yale. The city limits stopped at 41st to the south and Hudson to the east.
- Circa 1936, Triangle Blue Print and Supply Map of the City of Tulsa: Municipal boundaries are almost identical to the WPA map. This large map shows all streets and covers 81st West Ave to Memorial, 36th Street North to 61st Street, including many rural subdivisions. Red lines, mostly along major streets, aren't explained -- bus lines perhaps? A small Rand McNally pocket map of Oklahoma is on display in the same case.
- 1941, General Highway Map, Tulsa County: Shows numbered highways, municipal boundaries, rural school locations, and county road conditions.
- 1989, INCOG map of Tulsa Metro Area Average Daily Traffic Counts
- 1996, Tulsa Commemorative Character Map, World Graphics Map Company: Map is a cartoonish birds' eye view showing businesses that purchased the chance to be represented on the map. Remember Crystal's Pizza, the Browsery on 11th east of Harvard, Geo's Jumbo Burgers in the old Circle K at 15th and Sheridan, or the Billy Ray's BBQ location down the street in an old Der Wienerschnitzel A-frame building? They're all represented here.
- 2006, The Channels: Artist's conception of the Bing Thom / Warren family $700 million proposal to build islands with high rises in the middle of the Arkansas River north of 21st Street.
- 2017, Mending a Rift: Urbanism for North Tulsa: Maps and illustrations of a master plan for Greenwood and the demolished Near Northside neighborhood, developed by urban planning students from the University of Notre Dame, proposing to restore the urban street grid with dense, pedestrian scale development.
- 2018, Gathering Place map
Several maps deal with the oil and gas industry:
- 1956, Tectonic Map of Oklahoma
- Map of Glenn Oil and Gas Pool and Vicinity
- Locations of All Known or Reported Oil Wells, Gas Wells, and Dry Holes Drilled in Tulsa County: Also includes adjacent sections of Creek, Osage, Pawnee, Rogers, and Wagoner Counties.
Exciting news! Yesterday, Tulsa County Clerk Michael Willis announced that subdivision plats for Tulsa County are now online. You no longer have to subject yourself to downtown parking and courthouse metal detectors to access this fascinating trove of Tulsa history.
We have a pretty big deal launching in the Tulsa County Clerk's Office. After a lot of work, we have placed all the plats in Tulsa County on our website for free. I'm fortunate to have a great team that has worked hard to keep adding content to our website. If you're looking for a plat or some historical documents, you might check my website at http://www.countyclerk.tulsacounty.org/Home/Land and click one of the links near the top.
There are three categories of new content, each with its own index page:
Subdivision plats: A plat subdivides a large parcel of land into blocks and lots, which then become the fundamental unit of land ownership. Plats will also show public streets, common areas and private streets (typical for gated communities), easements, and covenants. Each city or town in the county has an original townsite -- Tulsa's consists of the tilted grid that runs parallel and perpendicular to the Frisco tracks -- and you will also find plats for towns like Red Fork, West Tulsa, Carbondale, Garden City, Dawson, Alsuma, and Highland Park that were ultimately annexed into the City of Tulsa.
Townsite plats, along with the plats of many older subdivisions, have the original street names, before they were renamed and renumbered to conform to Tulsa's grid. For example, the plat for the Orcutt Addition shows that what we know now as 15th Street between Peoria and Victor Avenues was originally called Cherry Street, and what we now know as Peoria was called Pine, and there's now a coffee house at the corner of Cherry and Jasmine.
Some of the plats show other interesting features. For example, the Park Hill Addition (just west of Owen Park) shows the route of the Oklahoma Union Traction Co. street railway (the company that also ran the electric interurban to Sapulpa), with a branch that terminates in Owen Park and another that continues along Easton Street. A proposed "subway" (underpass) is shown on Brady Street, which presumably would have replaced the streetcar's at-grade crossing of the MK&T railroad line. The plat for Irving Place shows the OUT line continuing west and around the Washington Irving Monument, which commemorates his visit to the area in 1832, as recorded in his book A Tour on the Prairies. The Owen Place addition shows a branch of the rival Tulsa Street Railway on Nogales Avenue terminating in a loop north of the MK&T tracks.
The plats page also includes the Comprehensive 1955 Zoning Map for the City of Tulsa, from the brief period when the city had extra-territorial zoning power within a five-mile radius of the city limits, a power that the courts nullified as the result of a lawsuit brought by the owner of Jamil's Steakhouse.
Platted indexes: The County Clerk logs deeds and other real-estate-related instruments (e.g., easements, condemnations, mortgages, lien releases, mortgage assignments, oil and gas leases) sequentially in books, but how do you find everything that might pertain to a specific lot? It's done with computers now, but previously paper indexes were used. The indexes are organized into a page (or more) for each subdivision and block, as each new deed is recorded. These books are now scanned and posted by subdivision and block. For example, on September 12, 1940, Ira D. and Ruth Crews sold Lot 1 and the north 2 feet of Lot 2 of Lamb Addition (southwest corner of Archer and Louisville) to a certain J. Robert Wills (a bandleader with a new hit record and a new bride). About a month later, Wills and his wife mortgaged the home with First National Bank of Anadarko for $3200, and a few days later the mortgage was assigned to Federal National Mortgage. He and his wife sold the property on February 13, 1946, to Mr. & Mrs. Robert E. Berry.
From the index for Johansen Acres Amended Block 3, we learn that James R. and Betty L. Wills bought lot 11 on May 23, 1958, and sold it on March 17, 1960. This would have been during the period that Bob returned to Tulsa and reunited with brother Johnnie Lee's band at Cain's Ballroom from roughly 1957 to 1959.
Unplatted indexes: What about land that isn't part of a subdivision? This land is usually described in terms of fractions of a section (square mile) within one of the statewide grid of 6-mile by 6-mile townships, e.g., the E 1/2 of the NW 1/4 of the SE 1/4 of Section 16, Township 17N, Range 5E. Unplatted indexes are organized by township and section, with markings to show which quarter-quarter sections are affected by a given instrument. While land can be divvied up in ways other than quarters and halves, the index provides a quick guide to which instruments might affect a given parcel, which then has to be confirmed by looking up the documents themselves. This is where you'd look to find the history of a currently platted parcel before it was platted. The index for Section 19, Township 19N, Range 13E -- 31st to 41st, Peoria to Lewis -- begins with a long list of allotments from the Creek Nation to various members of the Perryman family and others. O. Davis received an allotment deed for 2.5 acres on August 16, 1905, and on September 16 and 17, 1912, the Creek Nation removed restrictions on O. Davis's property. Using the index to read the original documents (or typed transcriptions) might tell an interesting story.
You can use these tools to trace your own family's history, too. I learned that in a little over a month's time will be the 40th anniversary of my parents buying our home -- I was in high school at the time.
I am grateful to Tulsa County Clerk Michael Willis for devoting his office's resources to making this happen and to the Tulsa County Republican voters who were wise enough two years ago to nominate Willis and end the 32-year reign of the Hastings-Wilson-Key-Rothman dynasty, a succession of County Clerks that stood in the way of greater public access to public records. Sometimes your vote actually makes a practical difference. We look forward to the results of Willis's ongoing efforts to make County Clerk records easily accessible to the public.
MORE: Historical Map Works has land ownership maps of the Creek Nation from 1910, Creek Nation 1910 Township Plats by Hastain and Model Printing Company. You can view and zoom the maps online, but you have to pay to download them.
It's a little strange to see Creek Nation boundaries being used as an organizing principle for maps made after statehood in 1907, but 1910 is soon enough that these maps may show Dawes Commission allotments to Muscogee Creek Indians and Freedmen. Surplus land would have been purchased by the U. S. Government from the Creek Nation and sold to other interested parties. I'm not sure if the color code (yellow or white) or notation (C or F followed by a four-digit number) indicates whether the land was allotted to an enrolled Creek or sold to a non-Creek. The maps show familiar Creek family names like Perryman, Tiger, Harjo, Yahola, Fixico, Rentie, Bible, and McIntosh, and family names that would be used for creek and park and subdivision names, like Berryhill, Woodward, Clinton, Childers, Hodge, Orcutt, Crowell, Fry, and Haikey.
The NW 1/4 of the SE 1/4 of Section 22, Township 19 North, Range 12 East, was Sue A. Bland's allotment. That's roughly between 36th Street, 38th Street, Yukon Ave, and 25th West Ave., and that's where oil was first struck in Tulsa County in 1901.
Three women named Glenn, Mabel C., Gracie, and Ida E., had 160-acre allotments in Township 17 North, Range 12 East. In 1905, Ida E. Glenn's allotment in the SE 1/4 of Section 10 was the site of the first well in the Glenn Pool, a massive discovery that would make Tulsa the Oil Capital of the World. The deed index for that section shows that I. E. Glenn received her allotment from the Creek Nation on August 28, 1903, and an oil and gas lease with W. S. Guthrie et al. was recorded on January 12, 1906, and renewed on March 9, 1908. The index for this square mile of land records oil and gas leases, pipeline right of way and conveyance, mineral rights, and many other transactions involving dozens of oil and gas companies over nine decades.
The City of Tulsa has collected a gallery of interactive maps of the city, depicting parks, creek watersheds, council districts, neighborhood associations, small area plans, and currently open permits.
On a sadder note, there are also maps of meth labs, sex offenders, crimes, and traffic accidents.
I've been watching politics for a very long time, going back to my childhood, so it's funny to observe the media's new-found concern about gerrymandering -- the practice of manipulating election district boundaries to benefit one party over another. The media's concern seems to have emerged with the growing dominance of the Republican Party in state legislatures and governor's mansions. (If that chart went further back, into the '70s and '80s, Democrat-dominated state governments would show up in greater numbers.) Suddenly, there are calls to take redistricting away from the politicians and put it in the hands of judges or computers or appointed commissions, or some combination of the three.
But a recently released, comprehensive archive of historical congressional district boundaries reveals that Democrats had no scruples against partisan gerrymanders when they had control of the process. Scholars at the University of California at Los Angeles have developed digital shapefiles of congressional districts going all the way back to 1789 and the 1st Congress. A Github site has the files organized by state and Congress; click on a link and you'll see an interactive map overlaying OpenStreetMap. You can zoom in and see how the old boundaries overlay towns and streets. More readily accessible, but without the interactive capabilities, is a Wikipedia page showing Oklahoma congressional district maps going back to 1972.
I had unsuccessfully been looking for old district maps for ages. I can't tell you how excited I was to find these.
As I said, I've been watching this process for a very long time. I remember 1982, when the Democrats in the Legislature, with Governor Nigh's approval, cut heavily Republican south Tulsa out of the 1st Congressional District, in order to improve incumbent Democrat Congressman Jim Jones's chances of survival, and shifted those voters into the heavily Democrat 2nd District, where their votes would be a tiny GOP drop in a big Democrat ocean. In that same redistricting, the Democrats at the State Capitol had the African-American neighborhoods of northeastern Oklahoma City share a congressman with the Panhandle and the wheat fields and cotton fields of western Oklahoma -- all to protect the Democrat incumbent in that district.
District 5, once compactly encompassing part of Oklahoma County, was stretched for hundreds of miles to take in Republican concentrations around Guthrie and Bartlesville. The Wall Street Journal mocked the District's twisted boundaries as "Mickey's Enchanted Kingdom" in honor of incumbent Republican Mickey Edwards. The new boundaries gave Edwards a very safe seat, while making it harder for Republicans to get elected in other districts.
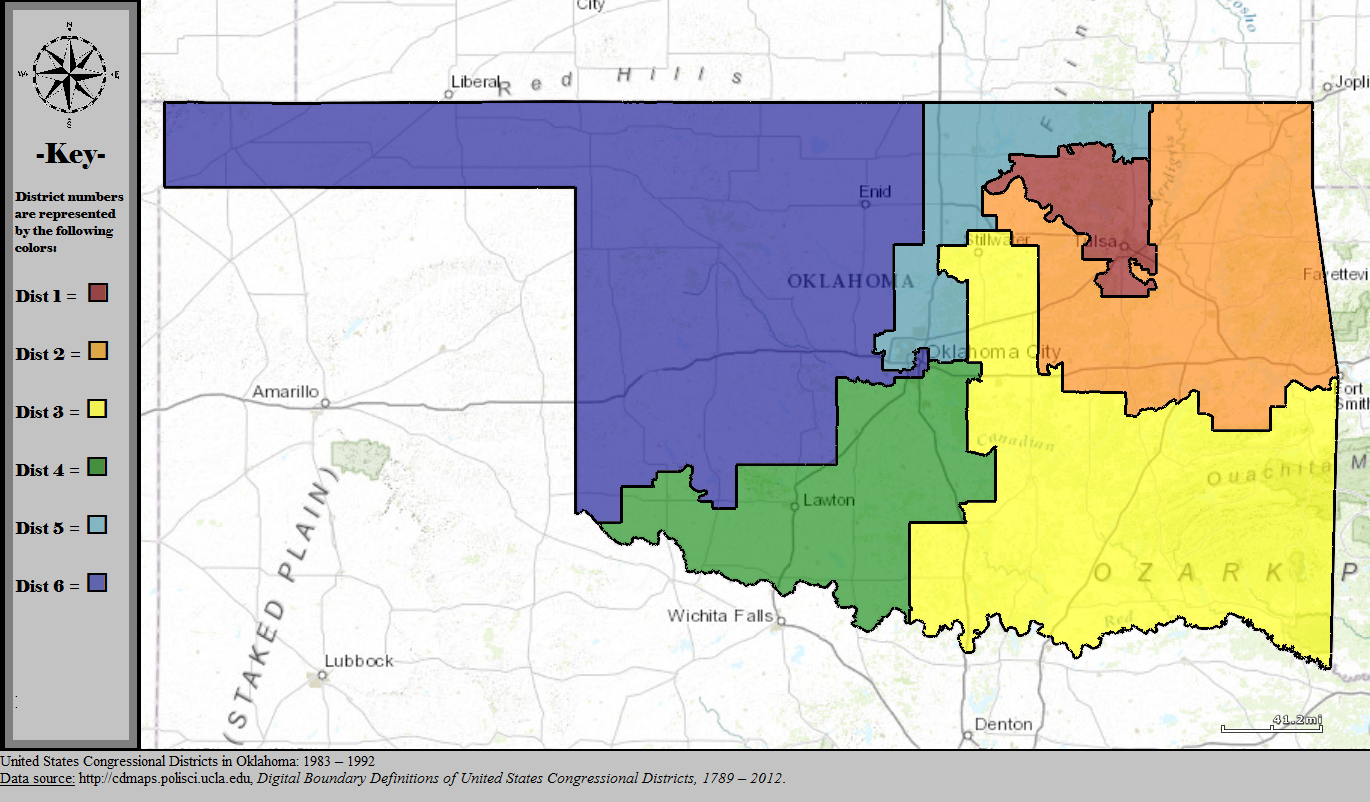
The resulting map contained the impact of growing Republican sentiment in the state, inspired by Ronald Reagan and the leftward shift of the national Democrat party, limiting the GOP to a single seat out of six.
I also remember walking blocks in 1988 for Jerry Riley, who was running for the open Senate 37 seat. That district consisted mainly of the rural and blue collar areas of western Tulsa County, but the boundaries crossed the river to take in a sliver of land between 21st and 56th Streets west of Peoria, including the luxury apartment building at 2300 Riverside. The story I heard was that the Democrat incumbent at the time of redistricting wanted to continue to represent the common people but preferred not to live among them.
These events inspired me to submit an op-ed to the Tulsa Tribune, published on May 31, 1991, opposing the practice of protecting incumbents in redistricting and urging an approach that focused on communities of interest and natural boundaries. I suggested an independent redistricting commission that would include unsuccessful candidates, the use of nested districts to make it harder to draw boundaries favoring an incumbent, and ratification by statewide referendum.
Although Republicans swept control of Oklahoma's congressional delegation in the 1990s, legislative redistricting protected rural Democrat incumbents by adding to each district just enough population from the growing suburbs to keep them viable. That tactic delayed the GOP takeover of the State House until 2004 and the State Senate until 2008. Term limits and the continued shift of the national Democrat Party to the Left ultimately overcame the Democrat advantage built into the maps.
Here's a map showing the State House districts drawn after the 2000 census, but colored to show party status after the 2010 election. Here's the State Senate district map following the 2000 census.
When they had control of the process, Democrats dismissed calls for redistricting reform as so much partisan whining by the GOP. They only seem to have warmed to the idea now that the shoe is on the other foot.
MORE:
Here are direct links to interactive versions of each Oklahoma congressional map since statehood. The dates refer to the election years affected; add 1 year to get the start of the corresponding congressional term. I've added notes after some of the links:
- Oklahoma congressional districts, 1907, 1908, 1910 elections (60th-62nd Congresses): Oklahoma was assigned 5 congressional seats at statehood.
- Oklahoma congressional districts, 1912 election (63rd Congress): Oklahoma was apportioned three additional seats, but these were elected at-large for one term.
- Oklahoma congressional districts, 1914 - 1930 elections (64th-72nd Congresses): The legislature got around to redrawing the district lines in time for the 1914 election. Congress failed to approve reapportionment after the 1920 census, so Oklahoma's lines were not redrawn.
- Oklahoma congressional districts, 1932 - 1940 elections (73rd-77th Congresses): Oklahoma's 1920s oil boom earned the state a 9th seat, but this was elected at-large; district boundaries did not change.
- Oklahoma congressional districts, 1942 - 1950 elections (78th-82nd Congresses): Dust Bowl emigration cost Oklahoma that at-large seat; boundaries of the 8 remaining districts were not changed.
- Oklahoma congressional districts, 1952 - 1966 elections (83rd-90th Congresses): Further outmigration cost Oklahoma two more seats. District lines had to be redrawn for the first time since 1914. Since the number of congressmen did not change in 1960, the legislature left the map alone.
- Oklahoma congressional districts, 1968 - 1970 elections (91st-92nd Congresses): This map reflects judicially-controlled redistricting to equal-population districts, pursuant to the Voting Rights Act
- Oklahoma congressional districts, 1972 - 1980 elections (93rd-97th Congresses): At time of redistricting, Republicans held districts 1 and 6 only. Long-time District 1 Republican incumbent Page Belcher had won the 1970 election by a narrow margin over Democrat Jim Jones, then opted to retire. The new boundaries added Democrats to and removed Republicans from the district; and Jones won the open District 1 seat in 1972, beating former Tulsa mayor Jim Hewgley by 11 percentage points.
- Oklahoma congressional districts, 1982 - 1990 elections (98th-102nd Congresses): At time of redistricting, Mickey Edwards of CD 5 was the only Republican in the Oklahoma delegation, but growing enthusiasm for Ronald Reagan and the Republican Party in Oklahoma forced boundary adjustments to protect vulnerable Democrat incumbents, like Jim Jones in CD 1 and Glenn English in CD 6.
- Oklahoma congressional districts, 1992 - 2000 elections (103rd-107th Congresses): At time of redistricting, Republican Mickey Edwards still held CD 5, and Republican Jim Inhofe had picked up CD 1 in 1986, when Jim Jones chose to challenge Sen. Don Nickles, so lines were drawn to pack as many Republicans as possible into those two districts.
- Oklahoma congressional districts, 2002 - 2010 elections (108th-112nd Congresses): After being on the bubble in the previous census, Oklahoma finally lost its 6th seat. At time of redistricting, five of six seats were held by Republicans; Democrat Brad Carson held the CD 2. 3rd District incumbent Wes Watkins retired prior to redistricting, avoiding the need to assign two incumbents to the same district.
STILL MORE:
thirty-thousand.org makes the case for a larger Congress, closer to the constitutional ideal of 30,000 people per seat. The site recounts the 1929 law that froze the number of House members at 435 and the negative effects of that decision.
Some links of interest to me and possibly no one else within a 500 mile radius:
(Remember, "blog" is short for "weblog," a log of things found on the World Wide Web.)
Some games for testing your knowledge of historic counties of Britain and Ireland:
- Historic Counties of Scotland: See the name, click on Clackmannanshire.
- Historic Counties of Ireland
- Historic Counties of England
- County-Wise quiz: Click on the name matching the highlighted county. Allows you to choose a number of counties to identify, a degree of difficulty, and to limit the game to one or more of the four countries of the UK. User interface is annoying.
1859 Encyclopaedia Britannica article on Ross and Cromarty: "two shires of Scotland, so curiously mixed up in geographical position, and so closely united politically, as to render their description under one head a matter not merely of convenience, but even of necessity." So the article begins. The county of Cromarty "is divided into eleven portions, which are whimsically inserted into various parts of the larger county of Ross, like fragments of a more ancient rock in some newer geological formation." When George Mackenzie, Viscount Tarbat, acquired the original county of Cromarty (mainly the port of that name and environs), he convinced the government of Scotland to annex to the county all of the other bits of land he owned, between 1685 and 1698. The article goes on to say that Mackenzie's Royston House (later called Caroline Park), near Edinburgh, was annexed to Cromartyshire, and that "many of the houses in the Canongate of Edinburgh belong to different counties in Scotland, from their having been the town residences of Scottish noblemen whose estates lay in those different shires. The total land area of Cromartyshire was estimated at 345 sq. mi.
To deal with the impracticalities of this sort of situation, the Parliamentary Boundaries Act 1832 reassigned detached parts of English and Welsh counties to the constituencies of the counties in which they were geographically located. A companion bill, the Reform Act of 1832 also eliminated representation (for "rotten boroughs") or halved it for some boroughs while creating new constituencies where there had been no representation. (Prior to the act, Old Sarum, an uninhabited hill in Wiltshire, elected two members of parliament.) In 1839, law enforcement and courts were reassigned to the county in which the detached part was locally situate. The Counties (Detached Parts) Act 1844 formally made these odd bits part of the counties which surrounded them, leaving only seven counties in England and Wales with exclaves.
County-Wise is the new website for the Association of British Counties, which "exists to promote the use of the historic counties as a standard geography for the UK." The historic counties movement is a reaction to the frequent reorganization of local government in Britain over the last half-century. Historic counties provide a permanent geographical framework and "fixed popular geography," even as local government boundaries continue to shift at the whim of the national government of the day.The site has a page for each historic county in Great Britain and Northern Ireland.
The National Library of Scotland's Georeferenced Maps allows you to overlay historic maps going back to the 18th century onto a choice of modern satellite imagery and maps. It covers Britain, Ireland, and Belgium. A slider control allows you to make the historic layer more or less transparent for comparing present-day features to historic maps.
The map at Wikishire overlays historic county boundaries on OpenStreetMap data. It shows the 20-odd exclaves of Cromarty. The map is based on the work of the Historic County Borders Project, which is creating a digital database for use in mapping and GIS. The current boundaries available are based on including small detached parts in the county in which they are situate, but a future dataset will provide boundaries including small detached parts as they existed prior to the 1844 act.
Here are some direct links:
- Historic Counties of Britain and Ireland, interactive map, showing pre-1844 detached parts (Definition B)
- Historic Counties of Britain and Ireland, interactive map, shown post-1844 detached parts simplification (Definition A)
- Historic County Borders Project shapefiles in SHP and KMZ formats, for WGS84 and OSGB36 coordinate systems, both Definition A and Definition B, with high- and low-resolution versions.
- Gazetteer of British Place Names: Search by postcode or town name for historic county.
RELATED:
In 1986, the BBC attempted to create a new digital version of the Domesday Book on the 900th anniversary of William the Conqueror's comprehensive survey of his new realm. Participants submitted photographs and descriptive text to document everyday life. The collected materials, which were organized by 4 km x 3 km grid cells, called D-Blocks, were archived on a special type of Laser Disc which required special computer equipment. The data was rescued from digital oblivion, and in 2011, the BBC solicited updated information from around the country. The National Archives now curates the collected BBC Domesday material. In the story of the project, there is a cautionary tale -- make provision for your digital legacy!
In a private venture in 2001, Adrian Pearce set out to 'reverse engineer' the original Domesday data and make it available to any Windows PC - instead of emulating it. In 2004 he succeeded and published the data online, the first instance of a Domesday website. However, on January 27th 2008, Adrian Pearce sadly died and the website was taken off line.
("Sadly died" is an odd formulation. "Sadly" doesn't really modify "died," as it isn't meant to tell us of Mr. Pearce's countenance upon his own demise. It's sloppy shorthand for "we are sad to say" or "we sadly report." Americans use "happily" or "fortunately" in this way, but this misuse of "sadly" seems peculiarly British.)
And then there's this, in the "Frequently Asked Questions" for the 2011 project. It's no longer enough to cringe at the nouns and adjectives used by Mark Twain or Rudyard Kipling; behold the speed of Newspeak's evolution:
The language in 1986 is inappropriate these daysThe articles were submitted in 1986 and the language used may differ from what we feel is acceptable today. However, this is now a historic record and therefore we have republished it intact.
ALSO SORT OF RELATED:
Voices from the Dawn has an interactive map of Ireland's ancient monuments. Click a hotspot and read an article about the folklore surrounding standing stones, dolmens, and the like, and view a virtual reality photo of the monument and its surroundings. It turns out a place we stayed 20 years ago this June, Holestone House, near Doagh, Antrim, Northern Ireland, was named for a famed 4 1/2 foot-high slab of rock with a hole through it. Engaged couples clasp hands through the waist-high hole as a symbol of betrothal, a custom that goes back for centuries.
We saw another of the monuments on the next year's trip, the Kilclooney Dolmen near Portnoo, County Donegal. I remember my wife's consternation when I told her we were going to see a dolmen, but couldn't (wouldn't, she thought) tell her what it was. No one really knows, although they're also called "portal tombs."
UPDATED 2020/03/02 to add some better links to maps and quizzes.
A remarkable and detailed 1921 map of Tulsa is available for viewing online, from the Special Collections of the University of Tulsa McFarlin Library. The inset map shows the entire city, and is captioned;
TULSA
AND ADDITIONS
A Ready Reference and Guide Map to Tulsa's
OFFICE & PUBLIC BLDGS. CLUBS, R.R. PASSENGER &
FREIGHT DEPOTS, SCHOOLS, CHURCHES, PARKS &
CEMETERIES, PAVED & UNPAVED STREETS & NAMES,
STEAM, INTERURBAN & STREET RAILROADS,
FIRE PLUGS, CITY & FIRE LIMITS
Subdivisions are clearly labeled. Around the edges of the map are alphabetical listings of the categories mentioned above, plus banks, streets, hospitals, apartment buildings, and hotels. The street car and interurban lines are very easy to spot.
The outer part of the map depicts "Tulsa's industrial and commercial district : showing office and public bldgs. R.R. passenger & freight depots." It is more detailed, labeling individual buildings, and it covers a solid rectangle from Denver to Hartford, Easton to 5th St., plus extensions in to the west (to Frisco between Easton & 2nd), to the east (to 3rd & Madison and Admiral & Owasso), and to the south (to 12th and Main). Beyond these areas are residences and farmland.
Two publishers are listed on the map, the Dean-Brumfield Co. of Tulsa and the Standard Map Co. of Chicago.
Also in the collection is the Fowler & Kelly Aero View of Tulsa, 1918 (UPDATE: The Library of Congress has a clearer, higher-resolution digital copy of Aero View of Tulsa, 1918.)
The only disappointment about these two maps is that they appear to have been converted to JPEG format, which is great for photos of real life, but produces annoying blurs and other artifacts as a result of its lossy compression algorithm. PNG, a lossless compressed format, would have been a better choice.
UPDATE: Paul Uttinger provides a link to a better copy of the Aero View of Tulsa, 1918.
UPDATE 2021/05/26: Replacing dead links. The University of Tulsa has moved to a new digital archive system. For the record, here are the dead links to old locations of the 1921 map and the Aero View of Tulsa, 1918 on oclc.org.
Pretty, pretty, pretty, and we get our first look at it tonight. Oklahoma's new election processing system comes with a fancy new election night reporting system, making it possible to see every race in the state -- from town trustee to president -- to see the results for each precinct as soon as it arrives at the county election board, and to know how each precinct and county has voted. It will make it much easier to analyze trends and project results.
Here's a direct link to the Oklahoma election night results website.
From a news release from the Oklahoma State Election Board:
Major features of Oklahoma's new election night results application include:
- Click the "State/Multi-County" button for state office results and aggregated results for multi-county local offices.
- Click the "County/Local" button to access a specific county's results page. (Note: County pages only include results for that county. For multi-county elections, aggregated results from all participating counties can be viewed on the State/Multi-County page.)
- Results are available in graph or tabular formats.
- Results may be viewed by county on the "State/Multi-County" results page, including viewing a map of the counties participating in an election.
- Results may be viewed by precinct on each "County/Local" results page.
- Results may be viewed by "type" - Election Day, Early Voting Absentee, or Mail Absentee.
- Election results reports can be exported in a variety of formats, including XLS and XML.
The Oklahoma House of Representatives will hold a session of its "Redistricting Listening Tour" in the Career Services Center auditorium of Tulsa Technology Center's Lemley Campus, 3420 S. Memorial, Tuesday, Jan. 25, 2011, at 7 p.m.
I hope to attend. Redistricting is a favorite topic -- it combines maps, math, and politics -- and it deals with fairness in representative government. My first published guest opinion was a May 31, 1991, Tulsa Tribune "Point of View" piece on redistricting: "Those Districts Belong to Us."
Although the population has shifted and the lines have been redrawn once in the subsequent score of years, the problem I described and the principles that should guide redistricting still hold true. I hope the first Oklahoma redistricting with my fellow Republicans fully in control will be the epitome of fairness and common sense. If Republicans could win a supermajority of seats in both houses despite the 2001 district lines drawn by Democrats to preserve their own power, the GOP can certainly hold the legislature with fairly drawn districts that reflect communities of interest rather than incumbent self-interest.
While I may not be able to persuade my friends in the legislature to draw fair lines, I hope at least that I can persuade the House and Senate to use common lines, as much as possible, to avoid some of the absurdities that emerged from the 2001 redistricting.
Meet Precinct 184.
This uninhabited precinct, home of Marshall Brewing Company (which didn't exist when the lines were drawn), is bounded by 6th and 7th Streets, Utica and Wheeling Avenues. In 2000, the Census Bureau defined it as tract 23, blocks 1064 (west of the tracks) and 1047 (east of the tracks).
It exists as a separate precinct because it is the only area that is in both Senate District 11 and House District 72. North of 6th St. is in SD 11 and HD 73. East of Wheeling and south of 7th is SD 33 and HD 72. West of Utica is SD 11 and HD 66.
State law (26 O.S. 3-116 A) requires that "The boundary line of any precinct shall not cross the boundary line of any district court judicial district electoral division or any congressional, legislative or county commissioner district." Had this block been included in the same precinct as one of its neighbors, this law would have been violated. Without this law, you might have voters in a single precinct voting in two different House or Senate districts, sending two different ballot versions into the same ballot scanner.
The lack of collaboration between House and Senate on boundaries forced the Tulsa County Election Board to create this unnecessary precinct and at least four others, two of which are uninhabited.
Precinct 187 (Tulsa County 2000 census tract 46, block 1994) is a triangle bounded by the eastbound and westbound lanes of I-244 between the west bank and the centerline of the Arkansas River. Formerly a part of precinct 801, it is the only sliver of land (sand, more truthfully) in both HD 66 and SD 37.
Precinct 185 is Tulsa County 2000 census tract 76.10, block 1015, bounded by Riverside Drive, the east bank of the Arkansas River, Joe Creek, and a bike path (roughly the continuation of Trenton Ave.) It is the only census block in both SD 37 and HD 69.
Precincts 179 and 180, near 76th St between Yale and Sheridan, have a few voters each. They exist because the House chose the east-west center line of the section as a boundary between HD 67 and HD 79, while the Senate chose a series of streets that cut across the square mile -- 76th St, Erie Ave, and 77th St -- to divide SD 25 from SD 39.
There very nearly were more microprecincts. House and Senate mapmakers differed over whether the westbound or the eastbound lanes of the Broken Arrow expressway between Harvard and Pittsburg should form a district boundary. But it appears that this narrow strip of land, tract 39, block 4001, in HD 71 and SD 33, was attached to precinct 71, just to the west.
Mercifully, Oklahoma law allows the creation of "subprecincts" in such cases. A subprecinct can share precinct judges and a polling place with a neighboring precinct, but it still must have its own ballot box. Depending on which races are contested, it may require its own ballot to cover its unique combination of districts.
How did this happen? Each chamber of the legislature worked separately on its own plan, without reference to the Other Body, defining districts in terms of U. S. Census Bureau census blocks, rather than in terms of boundary lines. Wherever there's a street, a stream, a railroad, or a political boundary, there are separate census blocks on either side. The Census Bureau provides a database with population counts by census blocks, and each house divvies up counties, census tracts, and census blocks in order to produce contiguous districts of roughly equal population.
Rather than repeat the same folly, I urge our legislature to use common boundaries to define House, Senate, and Congressional districts. Since the federal courts tossed aside our constitutional provisions on legislative apportionment back in 1964, the number of legislators in each house has been defined by statute.
So let's add two senators to make 50, subtract one rep to make 100. Define 100 State House districts. Combine them in pairs to make 50 Senate districts. Combine 10 Senate districts into each of our five Congressional districts. Or start with Congressional districts and divide them into 10 Senate districts each, and each Senate district into two House districts.
Either way, it would make it easier for constituents to know who their legislators are, would make it harder to use district boundaries to protect incumbents, and would make it easier for county election boards to draw precinct boundaries.
MORE:
2000 Census maps of Tulsa County, showing census tracts and blocks
Tulsa County Election Board maps of precincts and districts.
Title 14, Congressional and Legislative Districts. For some reason, you can find the detailed definition of 2001 Senate districts here, but not House districts, so here is the rich-text format (Word-compatible) version of HB 1515, the 2001 Oklahoma House redistricting bill as signed by the governor.
Clearing out my browser tabs and clearing my conscience of failing to write a blog post about each one:
Gabriel Malor, co-blogger at Ace of Spades HQ, will be on 1170 KFAQ with Pat Campbell at about 6:30 to discuss the CAIR lawsuit to stop Oklahoma's anti-sharia amendment.
Joe Miller is just a hat shy of looking like Bogart as Fred C. Dobbs in Treasure of the Sierra Madre (or the parody of the character in a Bugs Bunny cartoon): "Say, pardon me, but could you help out a fellow American who's down on his luck?" The stubble probably cost him the election. Either shave it off or grow it out to a respectable length. "Miami Vice" has been off the air for 20 years.
Tulsa Public Schools to consider eliminating schools: KRMG news story says the Tulsa district has 90 schools, same as the 1960s, but we have only half the students today that we did 40 years ago. The student population stat sounds right, but the school count can't possibly be the same: TPS has closed plenty of schools since peak baby-boomer enrollment, including more than a dozen I can think of off the top of my head: Mason High School; Bates, Lynn Lane, Lincoln, Lowell, Longfellow, Pershing, Revere, Franklin, Riley, Ross, Whittier (or Kendall -- they merged) Elementary Schools; Horace Mann Jr. High, Wright Jr. High (repurposed as an elementary). Did I miss any? I can't think of the name of the old elementary school near 45th and Peoria that now serves as home of the Tulsa Ballet.
Brandon Dutcher at Choice Remarks links to a HuffPo entry by John Thompson about the projected low number of graduates for African-American males in Oklahoma City Public Schools neighborhood high schools. Thompson calls this a crisis, but he uses too many qualifiers to exclude too many students who are being educated successfully in OKC public schools (e.g. students at charters like Harding High School, magnet school students, students in inner-suburban districts), and he fails to give us numbers as bases of comparison (how many total African American male students in neighborhood high schools are there?). Oh, and he's wrong to equate neighborhood schools with non-selective schools. Charter schools can't select their students, either. There's probably a story here, and it may be jaw-dropping, but it needs a teller who'll be more careful handling the numbers.
Thompson links to this interesting map of the OKC metro area showing population as color-coded dots - whites are red, African-Americans are blue, Asians are green, and Hispanics are orange. Each dot represents 25 people. Thompson says it shows racial segregation, and while it's true that there's a predominantly African-American area between the Santa Fe tracks and I-35 as well as a rural African-American area in NE Oklahoma County, and undoubtedly this reflects the official and unofficial segregation of earlier decades. But a look at the big version of the map shows blue dots scattered through out, alongside red, green, and orange.
Here's the Tulsa race and ethnicity map from the same set. Note how colorful the ORU campus is.
Cassy Fiano writes that feminist blogger Jessica Valenti is a big ol' chicken for refusing to participate in a panel discussion that includes just one conservative woman.
Sarah Palin to freshman Republican congressmen-elect:
Remember that some in the media will love you when you stray from the time-tested truths that built America into the most exceptional nation on earth. When the Left in the media pat you on the back, quickly reassess where you are and readjust, for the liberals' praise is a warning bell you must heed. Trust me on that.
Ed Morrissey recounts a Clarence Thomas anecdote about justices reacting to social pressures and remarks:
With that in mind, the freshman class should steel themselves that getting the job done right will mean few plaudits in the media in the short run, even fewer speaking invitations, and no medals or plaques from lobbyists and Academia. Their reward will be a more secure, less indebted, and fiscally restored United States of America, and the gratitude of a nation in the long run for restoring sanity and accountability. And frankly, that should be enough.Warner Todd Huston reports that mainstream media's coverage of a crooked Maryland county politician has (once again) neglected to identify the crook's party affiliation.
Muslim extremists protest Armistice Day in London. And J. E. Dyer comments on the shifting of Britain's place in the world as the U. S. under Obama has distanced itself from the Special Relationship the two countries long enjoyed.
Tim Bayly writes about the new NIV's further slide away from scripture and toward political correctness.
Jamison Faught, the Muskogee Politico, has painstakingly put together a series of maps illustrating the county-by-county results of the 2010 Oklahoma general election.
The maps are pretty and telling. The darkest red continues to be wheat country, the northwest quadrant of the state, plus Kay and Washington Counties, a traditionally Republican era even when the Democrats dominated state politics. The lightest red (and sometimes blue) area is Little Dixie, roughly south of a line from West Siloam Springs to Wewoka and east of a line from Wewoka to Durant. As you might guess from the nickname, this is the most traditionally Democrat area of Oklahoma. This is Carl Albert and Gene Stipe country.
But the maps highlight one notable exception to the Little Dixie bloc: McCurtain County, in the southeast corner of the state. Anyone know why that is?
McCurtain County elected a Republican for House District 1: Rusty Farley beat incumbent Democrat Dennis Bailey, a rematch of the 2008 election. Bailey was a cooperative extension service agent for over 30 years. Bailey had raised $21,149 by October 18, plus another $2,000 by the "last-minute" disclosure deadline of October 26. Farley had raised $170 by October 18 and didn't file a last-minute report. Jamison Faught points out that only 12% of voters in the district are registered Republican. How in the world did this happen?
Not only did Farley win in McCurtain County, but the county stands out in red contrast to the rest of Little Dixie in many other races. More McCurtain County voters voted straight party Republican than straight party Democrat.
Jamison's State House and State Senate maps show the gains Republicans made this year, term limit opportunities in the House in 2012, and which Senate seats are up for election in 2012.
Several of the statewide maps show some hometown pride. The only four counties won by Jari Askins were near her home base of Duncan. Kenneth Corn, Democrat candidate for Lt. Governor, managed to win his home county of LeFlore and neighboring Haskell County; meanwhile, his Senate seat went Republican. I'm going to guess that AG candidate Jim Priest has some personal connection to Pontotoc County.
For your next task, Jamison: The Oklahoma State Election Board has posted precinct-level election results for the 2010 general election. Have fun with it!
Tulsa County Assessor Ken Yazel's website now has a great new feature: You can search online for Tulsa County property information, including ownership, valuation, physical characteristics (e.g., sq. ft.), and recent sales -- for free, 24/7! Previously you either had to go to a library branch or pay to subscribe online (and only with the County Commission's approval). Some at the county courthouse were resistant to making public information readily available, but Yazel was persistent, and the entire budget board (all 8 elected officials) approved the new online searchable database.
I've been hoping for this for a very long time. Yippee!
My apologies for the lapse since my last post. I've been writing, but it's all technical stuff for the gig that pays most of the bills.
While I was at the Coffee House on Cherry Street cranking away on that technical documentation, a customer at the next table, a gentleman named Cecil Cloud, said hello, identified himself as a BatesLine reader, and mentioned a post here about historic maps.
Cecil showed me an amazing collection of U. S. Geological Survey maps of Indian Territory and Oklahoma, online at the University of Texas Perry Castañeda Library Map Collection. Most of the maps predate statehood.
Take a look at this map showing Tulsa as part of the Claremore quadrangle, 1897. What's fascinating is that this is before the Dawes Commission, before land was allotted in quarter-sections to enrolled tribal members, and therefore before the familiar grid of section line roads was established. The townships, ranges, and sections were established, and are shown on the map as a reference grid, making it possible to pinpoint old locations with respect to the present day arterial grid. But the roads on these pre-1900 maps show a network of roads that follows the land, connecting settlements as directly as the terrain will allow.
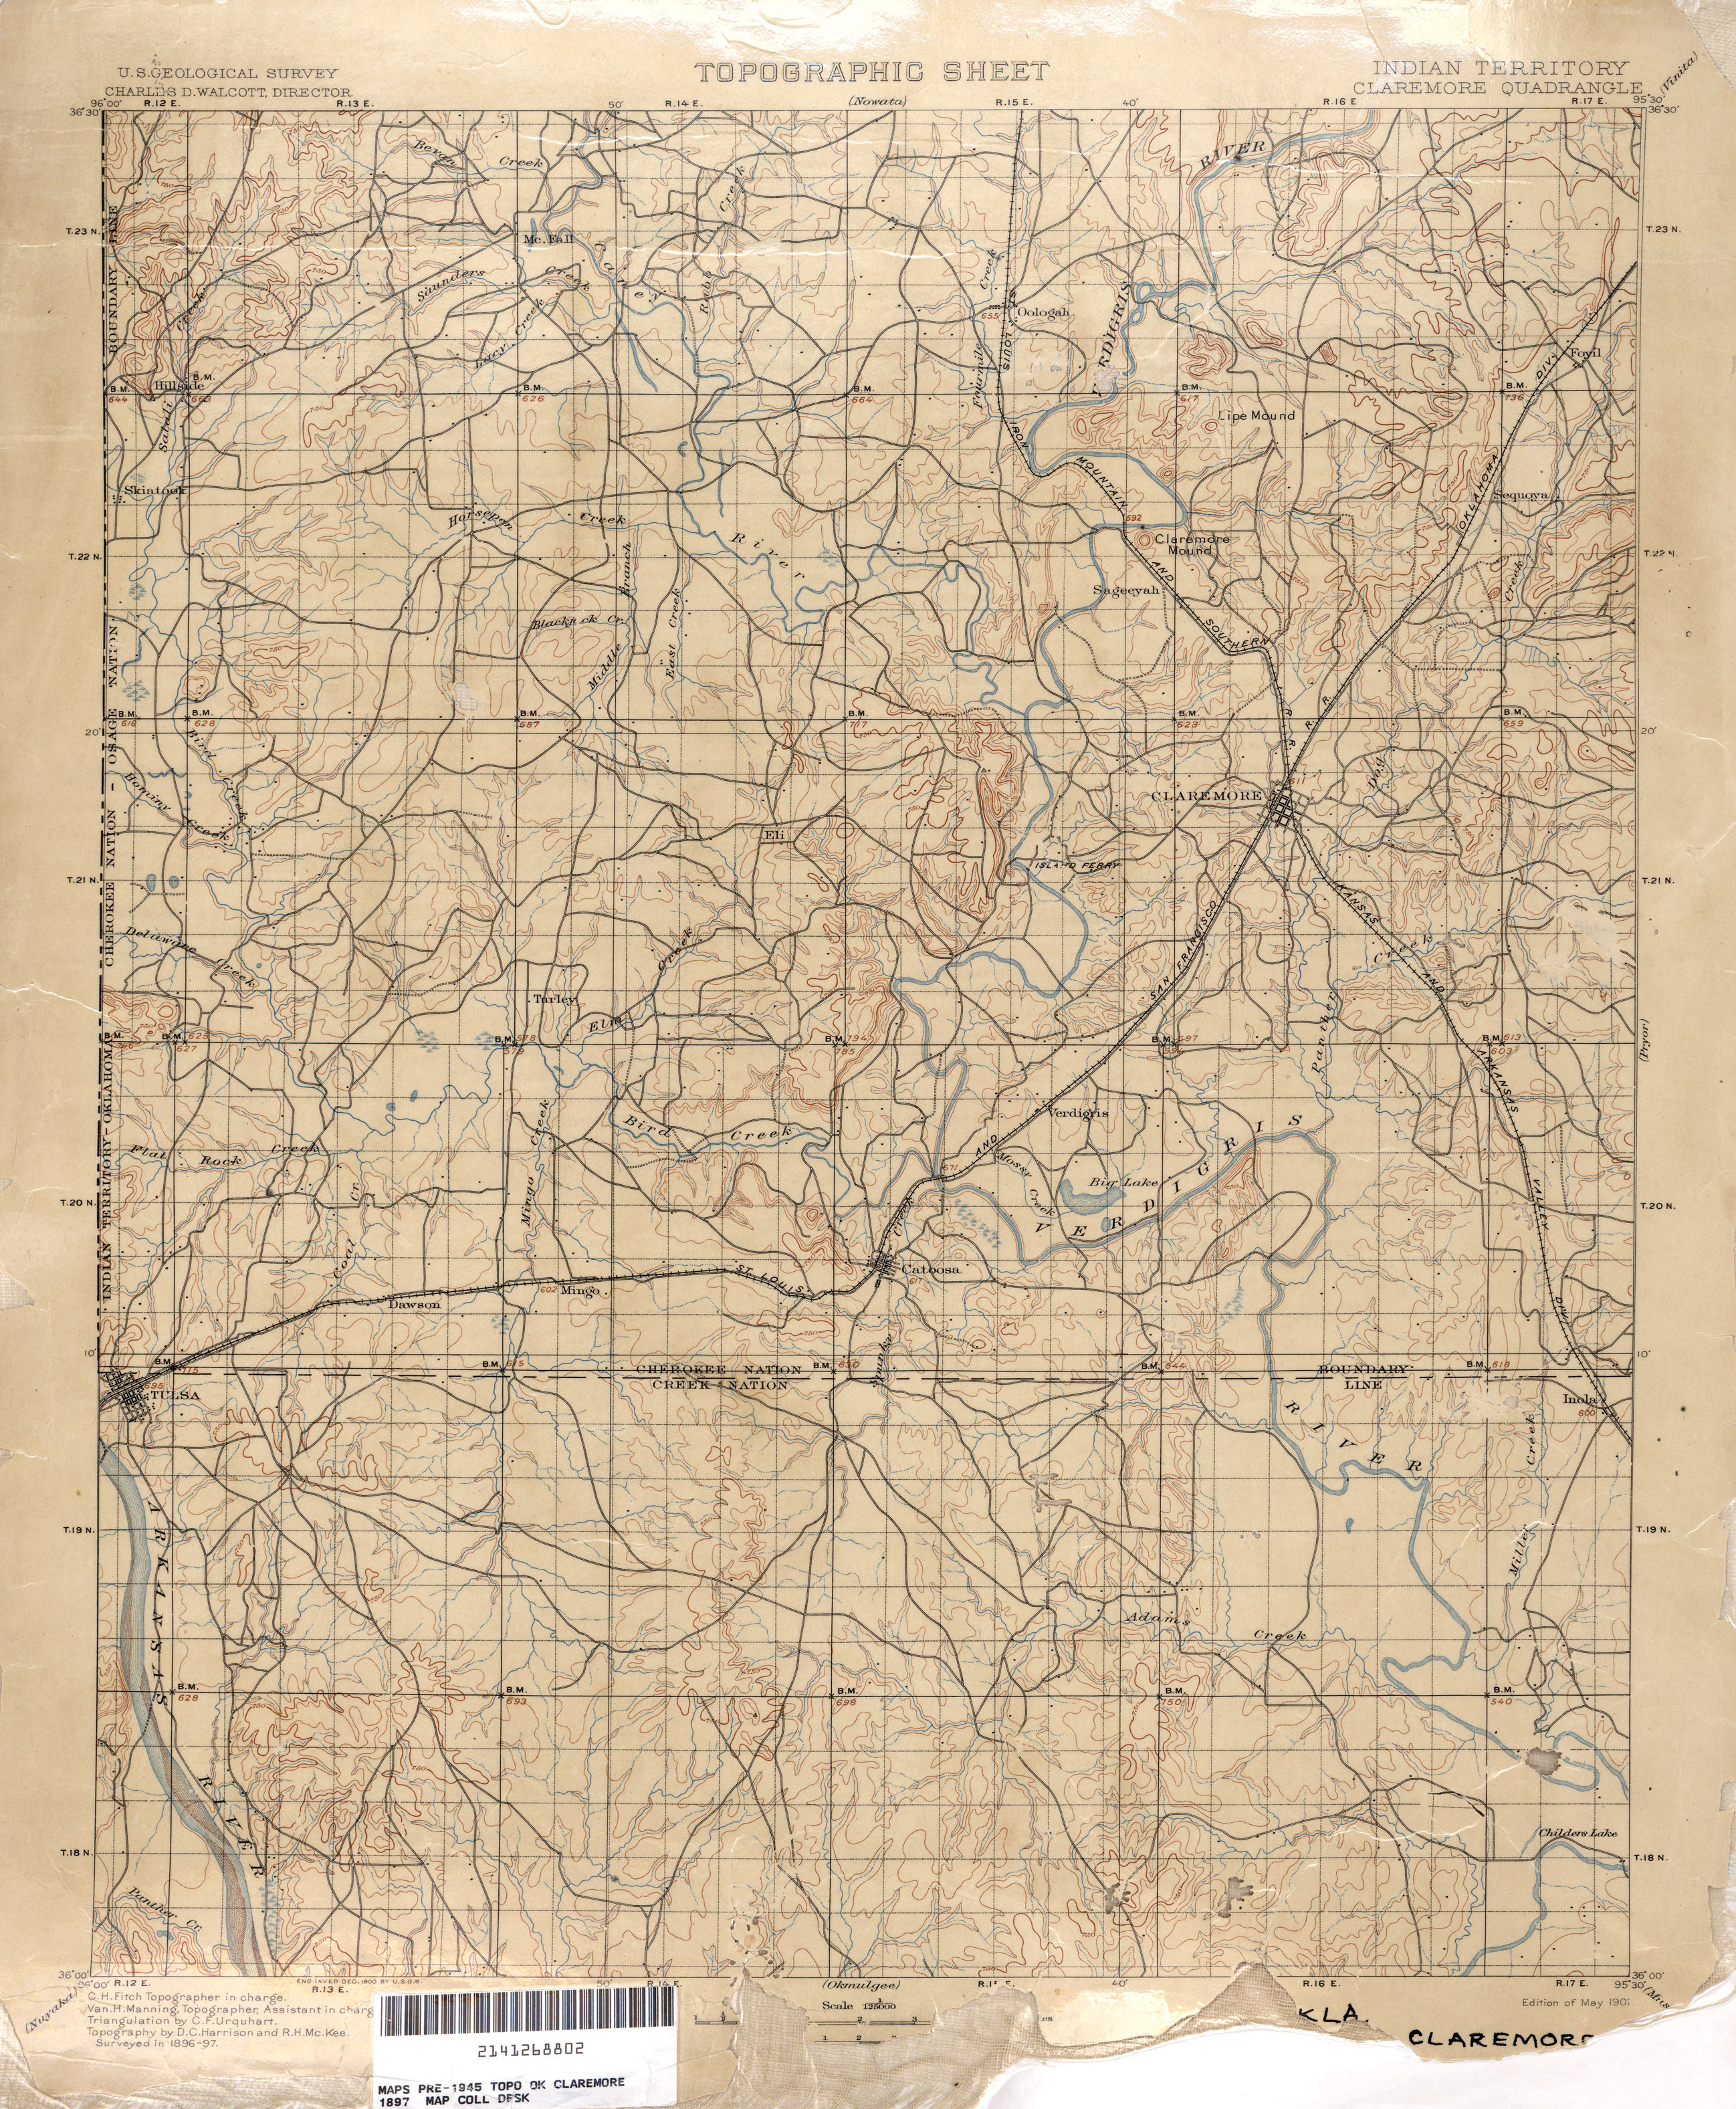
Here's the section of the map covering what is now midtown and downtown Tulsa.
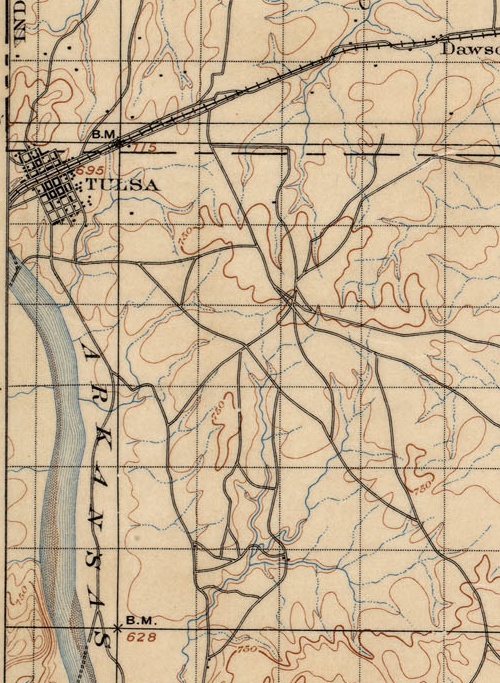
The grid of early day Tulsa is there, laid out parallel and perpendicular to the Frisco tracks which gave birth to the town. But the grid extends only from modern day Cameron St to 4th St, Cheyenne Ave to Cincinnati Ave. Beyond that, notice the hub of trails just east of present day 21st and Harvard, probably close to the high point that was more recently occupied by a water tower (just east of 21st and Louisville).
Notice too the creeks and streams, long before they were turned into underground storm sewers or rerouted into concrete channels. It's interesting, too, to see the locations of fords and ferries.
Here's an interesting contrast in the neighboring quad to the north, covering Washington, Nowata, and northern Rogers counties:
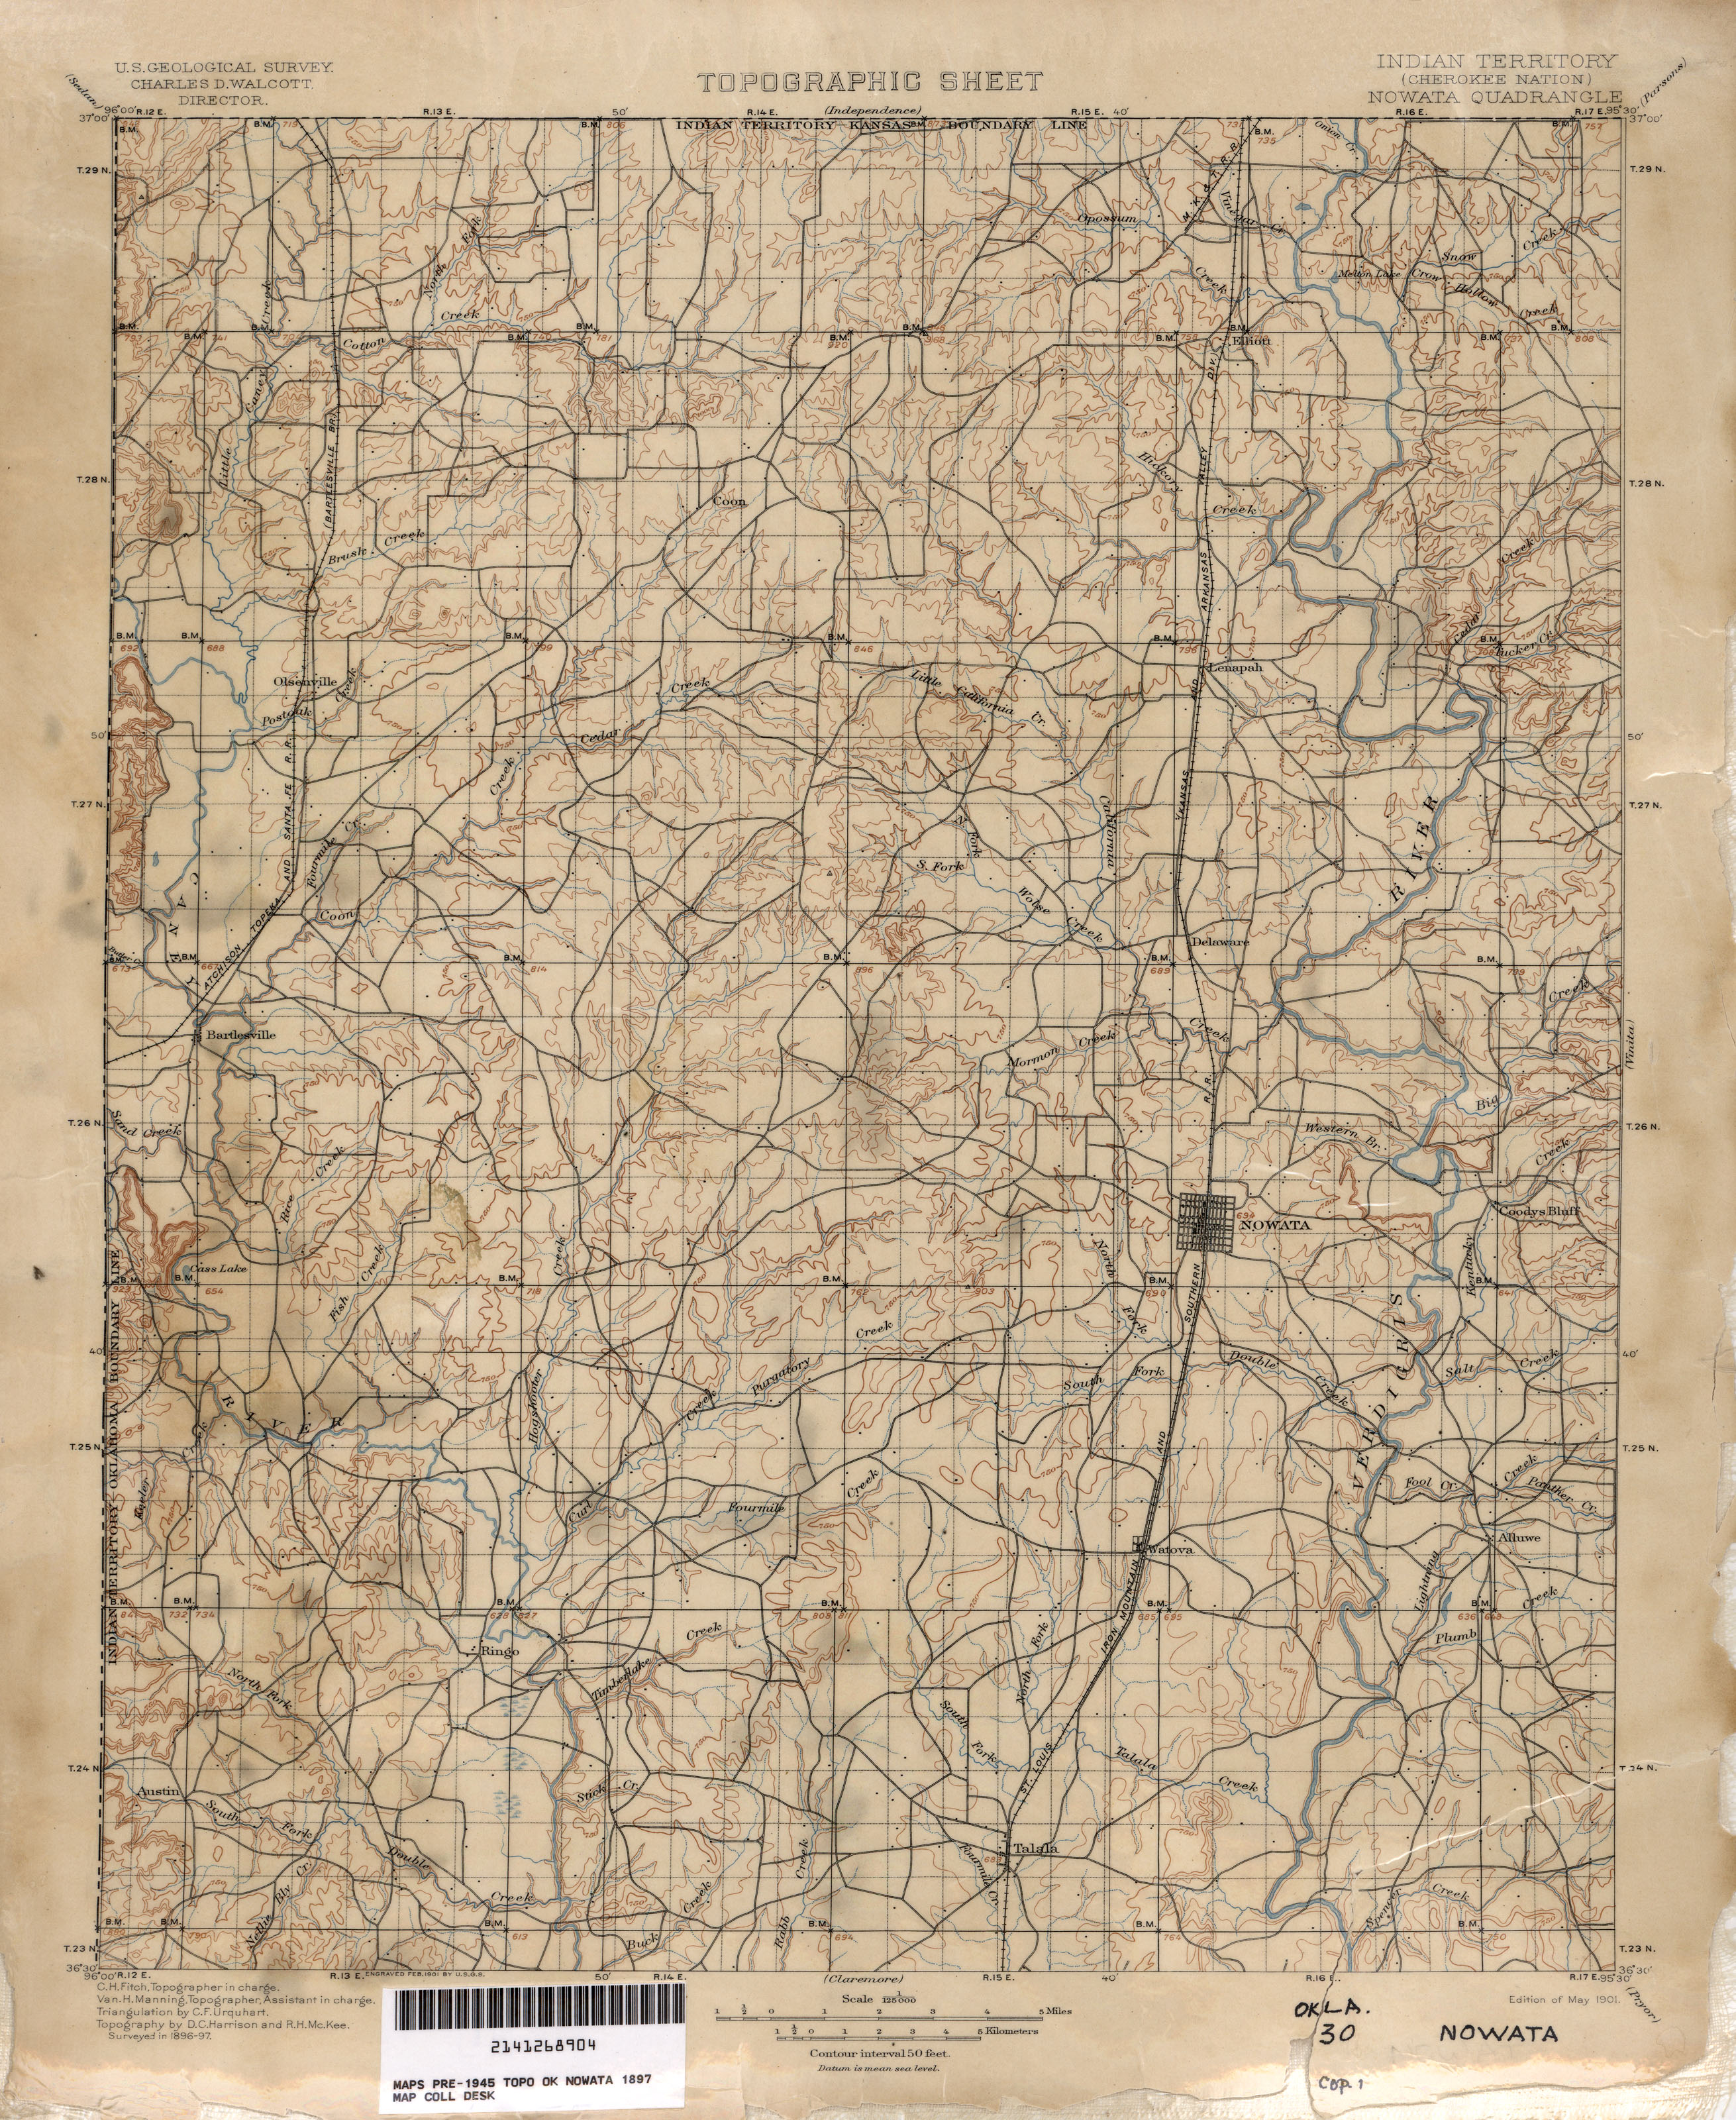
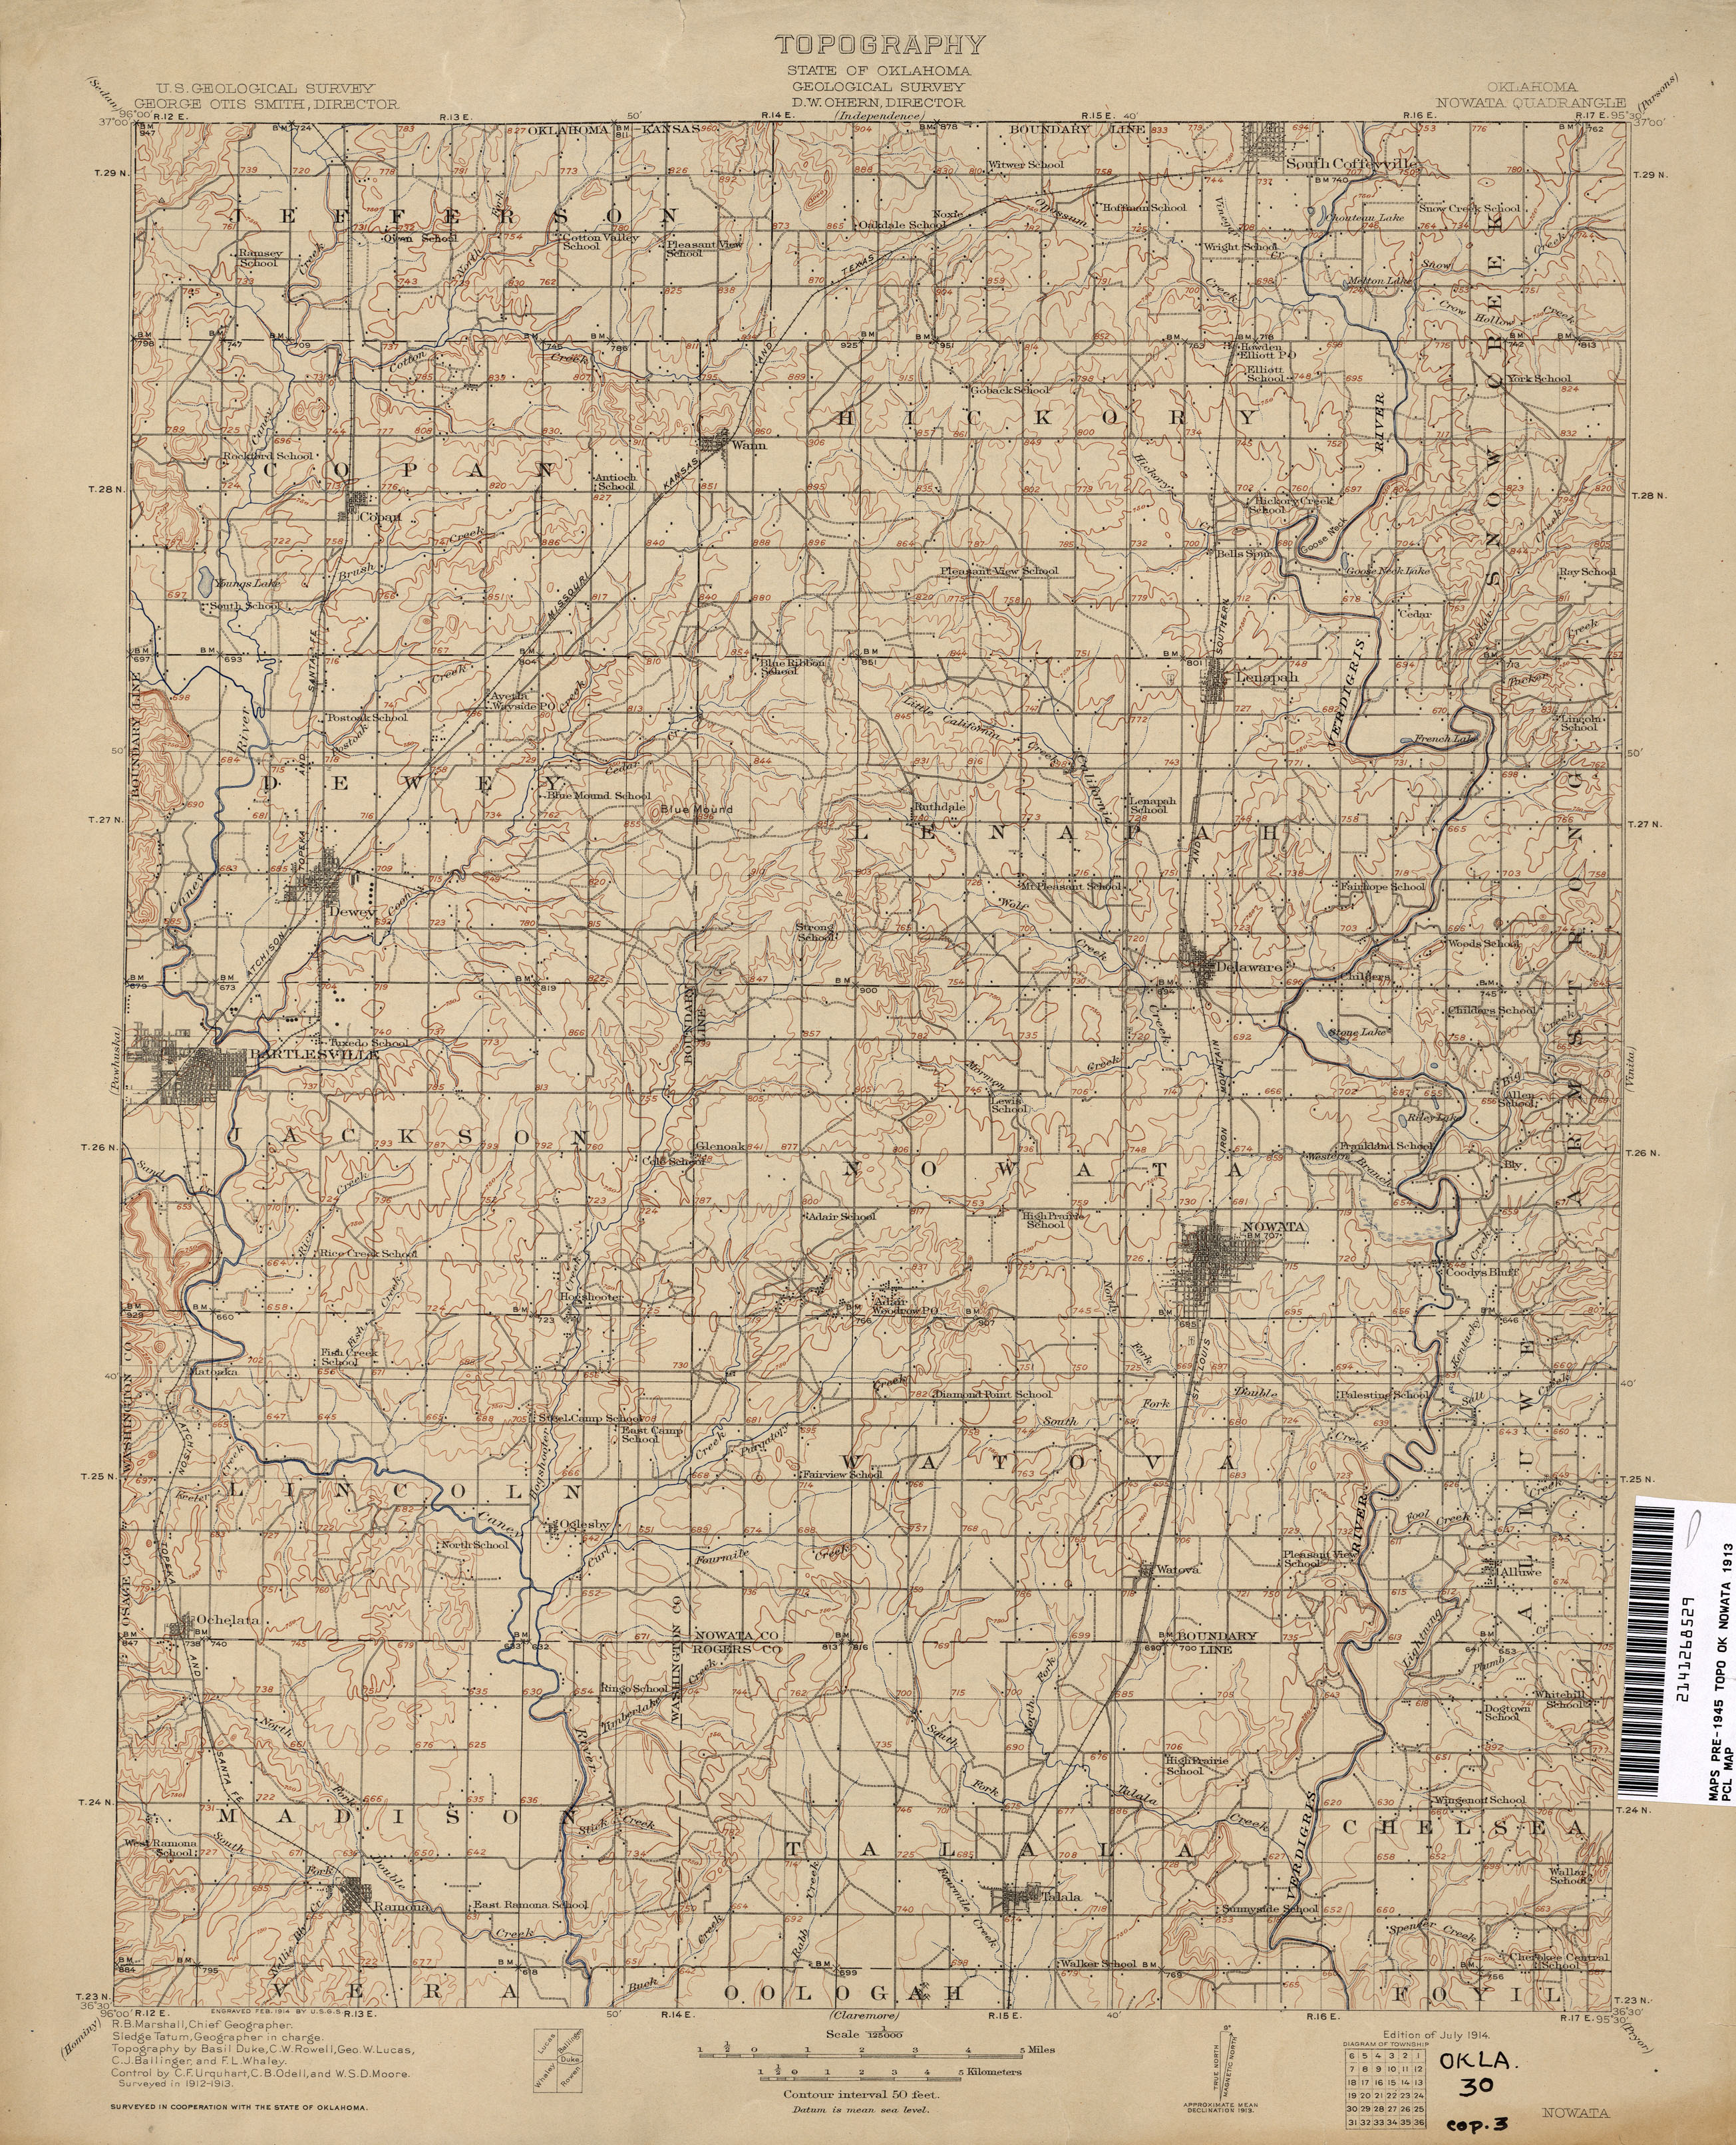
In just 16 years, the network of trails has been mostly replaced with a grid of section line roads, new towns have been established, and every few miles there's a school. Note the electric railway linking Bartlesville, Tuxedo, and Dewey.
More amazement at the PCL online archive:
1:250,000 USGS maps, including Tulsa maps from 1947 and 1967, covering all of Oklahoma northeast of Jenks. Note that the 1947 city map of Tulsa shows the Tulsa County Fairgrounds within the Tulsa city limits. The 1947 topo map shows the Union Electric Railway connecting Nowata and Coffeyville.
McGraw Electric Railway Manual Maps, 1913: Streetcar maps from nearly everywhere except Oklahoma, including Joplin, Little Rock, Dallas, Fort Worth, San Antonio, and Brooklyn.
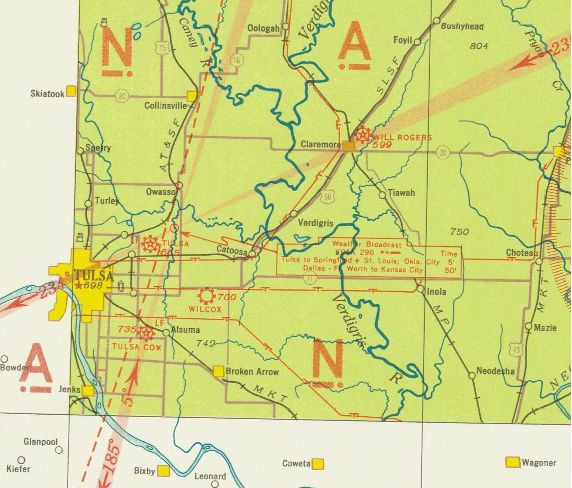
Via the Google Earth Library blog, I found a collection of historic navigational charts for air and sea travel on the website of the National Oceanic and Atmospheric Administration. It's the Historical Map and Chart Project of the Office of Coast Survey. You can search the collection by state, date, type of map, or keyword. Here are a few that may interest you:
Civil Airways and Mileage, 1948
This map shows major airports and the designations for airways connecting them. With a few exceptions the US three-letter airport codes were then as they are today -- e.g., INK for Wink, Texas -- although the Canadian two-letter codes later had a Y prefixed to them.
Tulsa section of United States Airway Map, 1934
Wichita section of United States Airway Map, 1933
These maps show airports, navigational aids, and land features visible from the air -- tank farms, highways, railroads, electric transmission lines, and bodies of water. The two maps together show the areas west, north, and east of Tulsa in the early '30s.
The Tulsa map shows the old alignment of US 66 through Tulsa, which jogged north from 11th St. to Admiral Pl. on Garnett (or so it would seem on this map. The fairgrounds race track is depicted. Note that what is now US 69 through Welch, Vinita, Pryor, and Chouteau used to be called US 73. Notice too that roads that these days travel diagonal paths used to jog back and forth on section line roads. The map shows Tulsa's main airport on N. Sheridan, Tulsa Commercial Airport at 51st and Sheridan, and Wilcox Airport, which may be the predecessor of Harvey Young Airport.
The roads depicted nearest Tulsa are a bit puzzling and don't seem to be to scale, but it looks like Peoria, Lewis, and Harvard extending to the south. It appears to show 96th St. going from the Jenks bridge to Mingo Rd., but perhaps that's meant to be 101st.
The Wichita chart shows Tulsa and the areas north and west. That road extending east of Jenks is labeled US 64 -- probably an error, but perhaps not. Look west of Sand Springs to see the now-inundated town of Keystone and the path of US 64 before Keystone Lake and Dam.
Up in Osage County, there's a substantial-looking place named DeNoya. The town, informally known as Whizbang (a name deemed too undignified to grace a post office), is now a pasture. When I was last there, in 1988, nothing remained but the footings of a few buildings.
The red stars on the map mark flashing or rotating beacons that marked the path of airways for nighttime navigation.
Oklahoma City sectional chart, 1950
This more recent map covers a smaller area than the 1930s sectional charts. It's interesting to see how small (relatively speaking) and fragmented Oklahoma City was, before the massive annexation about a decade later.
 Too tired tonight to do much more than link. I've been working on a post about the Oklahoma City Union Station rail yard / I-40 relocation controversy, but it's not ready. For now, here are links to some maps and other information about the history of the state's rail network, from most recent to oldest:
From the Oklahoma Department of Transportation's website. (Note how much of the network is owned by ODOT and leased to various railroads, including the entire Frisco route from Tulsa to Oklahoma City.)
- Oklahoma 2009 railroad map
- Oklahoma 2009 railroad map - reverse showing city detail
- Oklahoma Centennial 2007 railroad map
University of Alabama collection of historical Oklahoma maps. The browser is annoying, and you can't download high res copies, but there's some very interesting material here, including:
- A 1921 Rand McNally state map with railroads and interurbans, with more interurban station names
- 1917 Corporation Commission map of railroads and pipelines: The Tulsa County section is shown above
Note the interurbans connecting Bartlesville to Dewey, Nowata to Coffeyville, Oklahoma City to Norman, El Reno, and Guthrie, Lawton to Ft. Sill, McAlester to Hartshorne, Shawnee to Tecumseh, and Miami to the rest of the Tristate mining region. As far as I can tell, only Tulsa's interurban lines -- Sand Springs and Tulsa-Sapulpa Union (originally the Oklahoma Union Traction Ry.) -- remain in operation, as freight-only short lines.
OkGenWeb's 1915 state map with a list of railroad names and abbreviations -- high res scan
Doug Loudenback's high res scan of a 1905 map and gazetteer of the Twin Territories, with Doug's observations. The original: 1905 Premier series map of Oklahoma and Indian Territory (Library of Congress)
UPDATED 2023/12/29 to fix broken links to the University of Alabama map archive and to update the okgenweb.org link to point to okgenweb.net
Blair Humphreys has downloaded the latest version of Google Earth, 5.0, and reports a feature that will delight urban historian types: The ability to go back in time to earlier images.
The coolest new feature of the program is that it allows you to search historical aerials. With Oklahoma City, there are approx. 10 different aerial sets dating back to 1991, though only a few are from before 2002. Still, it is great to have access to a tool that records urban transformation.
He demonstrates with images of Bricktown from 1995 to 2003 to 2007. It's striking to see that, for all the new development -- the ballpark, the canal, the new development south of Reno -- very little was demolished over that 12 year period. Bricktown began with a great stock of older buildings, and those buildings have been reused, not replaced.
MORE: Although OKC did plenty of demolition as part of the I. M. Pei plan, their pre-World War II Civic Center -- City Hall and the Music Hall and the connecting mall -- replaced an old Rock Island rail yard. Doug Loudenback has a fascinating historical sketch of the planning and development of the Oklahoma City Civic Center.
The U. S. Geological Survey is mapmaker to the Federal Government, but their topographical maps are used by ranchers, hikers, hydrologists, miners -- anyone interested in the shape of the land and what lies beneath. Because they also depict cultural features in rural areas -- roads, houses, schools, churches, cemetaries -- they can be useful for recreating history, too.
Up on the fourth floor of the Central Library, quadrangle maps of the Tulsa area from the mid-to-late '70s are laid out atop the map cabinets. The maps are actually an update of maps from the 1950s, with changes marked in purple. While some features from the '50s are obscured, many are still visible.
Old USGS maps provide the kind of information about rural areas that the Sanborn Fire Insurance Maps provide for developed areas. I'd love to find Tulsa area USGS maps from the '50s and earlier.
I did find a bit of a 1913-4 USGS map showing Tulsa and environs from Pine to 111th St. S, and from the 96th Meridian (Osage County line, west of Elwood) to east of Yale. It's on p. 9 of the March 2006 issue of The Outpost, the newsletter of the Three Forks Treasure Hunters Club, in an article on historical USGS quadrangle maps. It's interesting to see what roads were there already, almost 100 years ago. Tulsa had grown only out as far as 21st and Utica, except for the western part of the Whittier neighborhood and an area labeled Kendall north of 11th between Lewis and Harvard. There's a place called West School on an unimproved road at about 76th and Delaware. The most interesting change: Back then it was called Jill Creek, not Joe Creek. (Or did the USGS man just mishear?)
Sometime this past winter (judging from how low the sun is in the sky and the presence of piles of ice storm debris in many photos), Google sent its 360-degree car mounted camera around Tulsa, taking street view photos of nearly every street. (Hat tip to Steve Roemerman, who to a Street View of his old house with his truck parked inside.
Street View images are more recent than Google's satellite view: The satellite still shows the old Mayo Meadow Shopping Center, while Street View shows Wal-Mart Neighborhood Market. Bell's Amusement Park is still there on the satellite image, but the replacement slab of asphalt shows up in Street View.
If you were wondering what was there along I-44 before ODOT bulldozed it, Street View can help (at least until they return for another pass). Here are the Monticello Apts. near 51st St and Birmingham Ave. And here's the entrance to Dick Gordon's guitar studio at 51st & Trenton.
(Too bad they didn't have Street View when Beryl Ford started collecting photos.)
There are all sorts of oddities that turn up. So far this is my favorite: The Street View of Cain's Ballroom shows people in sleeping bags lined up for tickets to some concert.
The folks over at TulsaNow's public forum are having fun spotting interesting street scenes and speculating on when the photos were taken. User PonderInc wants to know, "So, can we pay them to come back to Tulsa in April and May, when everything's blooming and green?!"
UPDATE 2009/10/12: Commenter Lacee Galloway writes:
Actually. This picture was taken on November 11, 2007. I know this because I am IN the picture. It was the day of a Hanson concert at the Cain's venue. My sleeping bag is first inline.
Via Gene Veith I found an interesting new blog called Strange Maps, which is exactly what you would expect -- unusual depictions of geography both real and imaginary.
Some of the maps are of never-realized political entities, such as the county lines drawn by the 1905 constitutional convention of the proposed State of Sequoyah. The accompanying text explains the formation of the Twin Territories, the history of the convention and the reason the state, which would have included the territory of the Five Civilized Tribes, never came into being. The map has the Sequoyah counties superimposed on the same range and township grid that we still use today, so it's easy to tell that Coweta County would have been east of Yale, between Archer and the Arkansas River, with Euchee County to the west and Cooweescoowee County to the north. Oklahoma's state seal owes much to the Sequoyah seal.
What caught my eye was this map, apparently from the wall of a Niketown store, of the "United Countries of Baseball" -- an attempt to map fan loyalties to Major League Baseball teams. It's especially interesting to see where they place loyalties to teams that share a city (Cubs/White Sox, Yankees/Mets) and how they split areas that are roughly equidistant from more than one MLB city. I think the Cardinals/Rangers line is too far east; Tulsa should be right on the border.
Here is a site called CommonCensus which is collecting and using online survey data to plot the same sort of map, not only for baseball, but for other major league sports, college football, and city spheres of influence. The baseball map puts northeastern Oklahoma predominantly in Cardinal Country. There are some surprisingly large Boston Red Sox enclaves in upstate New York, particularly in the Finger Lakes and Adirondacks regions. (Guess I shouldn't have been too surprised.)
The city-influence regions seem to follow TV and newspaper market areas pretty closely. Tulsa's zone is the 918 area code, plus a bit of southeastern Kansas, minus a strip along the Arkansas border that more closely identifies with Fayetteville or Fort Smith.
commoncensus.org are still collecting data, although they haven't updated their maps in many months. You can participate in their survey from the home page.
This may look like a souvenir from my recent trip to Britain with my 10-year-old for the Tulsa Boy Singers choir tour, but it's not, although the trip reawakened an interest in it.
This is The London Game, a strategy game based on a map of the London Underground. The object is to be the first to travel to six tourist destinations and return to your starting point at one of London's main railway stations. There are "hazard" cards that either delay you or allow you to delay another player. Each "souvenir" card has a drawing and a description of the point of interest and the name of the nearest Tube station.
I remember playing this game with a friend of mine when we were probably 10 or 11. His family subsequently put it in a garage sale or otherwise disposed of it. I had always thought it would be a fun board game to have.
Three times in the past I've been to the London Transport Museum gift shop in Covent Garden, and three times I've balked at paying the asking price, not to mention wondering if I had room and sufficient spare weight in my luggage for the box. Last month, the museum shop had a special edition in a metal box for the low, low price of 25 pounds sterling -- about $50, and too dear for me. Once back home, I checked eBay and found a copy of the 1972 edition. I was the only bidder and price and shipping combined came to $15.
While my wife and our 10-year-old went to hear Weird Al Yankovic in concert last Friday, and after I put the 18-month-old to bed, the six-year-old and I played the game a couple of times. We opted not to use the station blocking rule and instead concentrated on getting familiar with where everything is on the board and how the basic rules work.
We added a rule that you have to say the name of each station as you pass through it. I figure it'll help the kids learn to pronounce Gloucester, Leicester, and Tottenham correctly and how to interpret a map and plan a route, and we'll all build a mental map of London which will come in handy when we go back as a family someday. There have been a few changes to the Tube map since 1972, but not many to the central London section that makes up the game board.
We had fun playing it, and we each won a round. I'll have to try the more cut-throat version, where you can block stations to delay your opponents, with the 10-year-old.
As I mentioned in my initial Tulsa 1957 post, I wanted to be able to create maps showing where things were back then. I finally figured out a relatively easy way to do it, using Google Earth, and I found a number of online tools to minimize the amount of development work I would need to do.
My first exercise was to create a KML file showing all of the more than 400 restaurants listed in the classified section of the 1957 Polk Directory of Tulsa. The usual GIGO warning applies. If the Polk Directory was wrong, the file will be wrong.
I would like to add, but have not yet added, non-duplicate entries from the Southwestern Bell Yellow Pages. I'm limited there because a quarter of a page from the "Cafes" section of the 1957 phone book was torn out.
Google Earth makes it possible to include all sorts of information in a map -- with enough time and energy, you could include images of newspaper and phone book ads and building photos.
To build the file I used Excel to enter name and address, then used an online tool called BatchGeocode to convert each address to a latitude and longitude and to create a KML file, which Google Earth can read. I had to do a bit of tweaking to get the icons I wanted, and the Geocoder had trouble with some addresses that no longer exist (e.g., the 100 block of South Main, the 500 block of East Brady and East Cameron). (I pre-modified Sapulpa Rd and Sand Springs Rd addresses to the modern day names of Southwest Blvd and Charles Page Blvd.) For some reason, Pennington's Drive-In wound up in the south Atlantic Ocean, but I fixed it.
Google Maps can load and display small KML files, but not a KML file with 400 entries. So you'll need to have Google Earth installed on your PC to get the full effect. In Google Earth, you'll be able to hover over an icon to see the name, and click on it to see the address. Here again is the link to the KML file of Tulsa's restaurants in 1957 which you can download and use in Google Earth.
For those without, and until I can figure a dynamic way to display the map online, I've provided some screenshots from Google Earth below the fold. One is zoomed out to show the location of all restaurants in the city, the other is zoomed in to provide more detail between Pine and 36th, Union and Harvard.
A cool idea for future implementation: Google Earth is able to display a fourth-dimension -- time. If you could compile the restaurant listings for each year, you'd be able to move the time slider back and forth and watch as one restaurant replaces another, and as restaurants move out toward the suburbs. What an amazing way that would be to visualize the development and undevelopment of the city over time.
Speaking of undevelopment, notice some of the clusters of restaurants. There are eateries on nearly every block downtown, and there's a linear cluster extending north of the expressway -- that's Greenwood -- the Black Wall Street of America. There's a cluster along Quanah / Southwest Blvd in west Tulsa (another urban renewal removal). Sheridan Road was the key commercial link between the airport and the rest of the city.
I hope to post more KML files in the future, covering places like drug stores, groceries, churches, beer joints, bowling alleys, and movie theaters. It would speed up the process if some of my readers were willing to help transcribe phone book entries. I'm not quite set up to accept help, but in the not too distant future, I will be able to send you an image of a page from the Polk Directory and a template Excel spreadsheet for you to fill in. Let me know if you'd be willing to help in that way by e-mailing me at blog at batesline dot com.
And as always, if seeing the name of an obscure restaurant stirs some memories, drop me a line and tell me about it.
Pictures after the jump:
This may help stir some memories of late '50s Tulsa. Reader John Brandon sent along a scan of a 1958 service station map of the City of Tulsa. He got it as an eleven-year-old, and he marked it up (in black crayon) to show changed city limits resulting from annexation and the recently proposed freeway network. Click this link to open or download the 4 MB PDF of the 1958 D-X map of Tulsa.
(It's nice to find a kindred spirit. I was (and am) fond of collecting and annotating maps, too.)
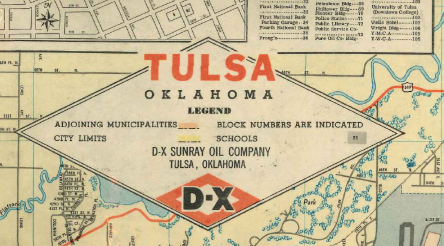
On the back of the map is a downtown grid, showing the location of important buildings, a map showing the route of the Tulsa Tour, and a county map, which shows the small cities and the locations of several rural schools, like East Central (then at Admiral and Garnett) and Rentie (81st and Harvard).
Here are some interesting things I noticed; please add your observations in the comments:
- On the county map, the N-S section line roads east of Memorial aren't named and go up in increments of 17, not 16 as they do today.
- I'm pretty sure that U.S. 169 came down Boston from 11th Street to connect to Boulder Park Rd and the 21st Street bridge. This map shows it coming down Baltimore Ave.
- On the county map, no Yale between 71st and 81st. No 61st between Sheridan and Memorial.
- The intersection of 31st and Yale, evidently designed to avoid two grade crossings of the M. K. & T. tracks.
- Alsuma (51st & Mingo) is still a separate town with its own street names.
- Other odd street names: Braniff Hills and Broadmoor Hills south of Southern Hills Country Club. Hidden Hill at... well, I'll let you find Hidden Hill.
- Where does downtown stop? It's a lot harder to tell without the Inner Dispersal Loop.
MORE MAPS: John Brandon was kind enough to scan some specific parts of the map:
The central Tulsa part of the main map (939 KB)
The map's cover (1.39 MB)
Downtown inset showing major buildings (845 KB)
Tulsa County map (619 KB)
Tulsa Tour route map (1019 KB)
Wow! The Oklahoma Department of Transportation has scanned and posted official Oklahoma state highway maps going back to statehood. There are the annual maps produced from 1924 to 1996, the biennial maps produced since 1997, and a few early maps from 1873, 1907, 1916, 1919, and 1921. For most of the maps, there's also a scan and a description of the back of the map.
I've been looking at the 1916 map, which shows the highways overlaid on the township and section grid, along with railways, rivers, and county lines. Although many of the inter-town routes on the map were later incorporated into numbered highways, not all were. For example, there's the road from Tulsa to Jenks: Peoria to 71st to Lewis to the 96th Street bridge. Or from Catoosa to Broken Arrow: 193rd to 11th to Lynn Lane. The road from Tulsa to Bixby and Broken Arrow went down Harvard and 51st to Memorial, with the BA route splitting off at 71st and the Bixby route, shifting 1 mile east at 111th to Mingo. The map shows the bridge crossing about halfway between Mingo and Memorial.
If you have trouble finding your way around the tidy Cartesian grid that defines Tulsa's street network, imagine learning your way around an ancient, complex, and chaotic street network, and keeping that map entirely in your head.
From the Transport for London website:
All licensed taxi drivers in the Capital must have an in depth knowledge of the road network and places of interest in London - the 'Knowledge'. For would be All London drivers, this means that they need to have a detailed knowledge of London within a six mile radius of Charing Cross. Suburban drivers need to have a similarly detailed knowledge of their chosen sector.
From a PDF document about the Knowledge of London examination system:
In order to complete the Knowledge you will need to know any place where a taxi passenger might ask to be taken and how to get there. To do this you will need to know all the streets, roads, squares etc. as well as specific places, such as parks and open spaces, housing estates, government offices and departments, financial and commercial centres, diplomatic premises, town halls, registry offices, hospitals, places of worship, sports stadiums and leisure centres, stations, hotels, clubs, theatres, cinemas, museums, art galleries, schools, colleges and universities, societies, associations and institutions, police stations, civil, criminal and coroner’s courts, prisons, and places of interest to tourists. Such places are known as ‘points’.
How do you organize all this information in your brain? You learn 320 "runs", divided into 20 lists of 16 runs. A run connects two major points, and you learn the route from one end to the other, the reverse route (which may differ because of one-way streets and turn restrictions), all points of interest along the way, and all points of interest with a quarter-mile of each end point.
After an introductory talk, you have six months to learn the first 80 runs, then you go through a self-assessment, just to see if you've got the hang of it. You have another 18 months to learn the remaining 240 runs. Then there are four stages of oral examinations, each of which may involve multiple exams before advancing to the next stage. According to Transport for London:
On average it takes an All London applicant 34 months to learn the Knowledge and pass through the examination process, 26 months for a suburban applicant.
Small wonder that that London cabbie was able to keep his composure when he unexpectedly found himself being interviewed on TV about an Internet intellectual property case. (Hat tip on the cabbie story to The Dawn Patrol.)
I went to a presentation this afternoon at Central Library about the digital version of the Sanborn fire maps. These are maps that were created for fire insurance purposes from before the turn of the 20th century through the 1960s, showing details of each structure -- number of stories, footprint, building material, and sometimes the name or type of business. It's a valuable resource for trying to reconstruct what was where at a given point in time.
Tulsa City-County Library card holders have access to fire maps for Oklahoma online, from anywhere on the Internet, via this link. If you're not in a library, you'll have to log in with your last name and library card number.
I've got an idea for a series about lost downtown Tulsa, going block by block, telling what was on each block over the years before it was turned into asphalt. These maps, combined with city directories, will be a valuable resource. Just so no one else claims it, I'll give you my working title: "If Parking Lots Could Talk."
We've all marveled over the detailed satellite photos available with Google Maps, but wouldn't it be even more useful to be able to see a street the way you'd see it from the ground?
Amazon thinks so. Via King of Fools, we learn Amazon's beta version of A9 maps is online, and for select cities and streets, you can view street level images of both sides of the street. For example, here's the 1400 block of SW 8th Street in Miami, aka Calle Ocho, the heart of Little Havana. (I'll explain why I picked that spot in another entry.)
One of the King's commenters couldn't see much value in this feature, called "blockimages," but I can imagine all sorts of uses. Suppose you're booking a hotel in a city you haven't visited. You could use blockimages to see what the surrounding neighborhood looks like. Or you've got to go between two places that are within walking distance; A9's blockimages will help you know if the path between the two places is really walkable.
I plan to use this feature to show you examples of good and bad streetscapes, the difference between places that are active and vital and places that are dead. Some may object that these photos only show what can be seen at street level, but for the purpose of illustrating good urban design, that's really all that matters.
I was going to include this in the roundup post below, but this deserved its own entry.
I first came across the Oklahoma Department of Transportation (ODOT) county highway maps back in the mid-'70s, when I would take the MTTA bus downtown from school on Wednesday afternoons and hang out at Central Library until Dad got off work. I could spend hours poring over maps, and became particularly fascinated with the ODOT county maps, which showed rural roads and locations of homes, businesses, farms, cemetaries, and schools outside the city limits. The maps indicated which roads were dirt, which were gravel, and which were paved. City limits and fence lines were shown, along with the odd exclaves -- places like the Tulsa Fairgrounds which are in the city but outside the city limits.
The ODOT map of Wagoner County included, as an inset, the first street map I had ever seen of my neighborhood, Rolling Hills, at the time an unincorporated subdivision in the northwest corner of the county. (We lived there from 1969 to 1978.) Most commercial city maps of the time didn't bother to show Tulsa beyond "Tulsa proper" (the pre-1966 boundaries), but even if a map did go out all the way to the new city limit, it stopped abruptly at 193rd East Avenue. So it was interesting to see, at last, how my mental map of the neighborhood, sketched by years of walking to church, riding my bike to the UtoteM and the In-N-Out (convenience stores), and visiting friends, matched up to the real distances and proportions shown by the map.
What really caught my imagination were the names and boundaries of townships -- county subdivisions that, as far as I am aware, have had no official function since the 1910s. These townships sometimes matched up to the Northwest Ordinance 36-square-mile townships, but mostly didn't. Tulsa County had Boles, Frye, Willow Springs, Lynn Lane, Wekiwa, Red Fork, Dawson, plus townships that bore the same names as still-extant towns: Collinsville, Owasso, Skiatook, Jenks, Glenpool, and Bixby. I had the idea that the old township boundaries could be put to use for city government. Tulsa (then governed by a board of city commissioners elected at-large) could have boroughs, just like New York City, using the old township boundaries to create some geographical element to city government.
When I was in college, my roommate had posters of the Landers twins and Morgan Fairchild next to his loft bed. I ordered some county maps from ODOT, used colored pencils to highlight the township boundaries, and put up Wagoner, Rogers, and Tulsa County on my side of the room. I wasn't making a statement. I just liked looking at the maps (although I'm sure not as much as he -- or I -- liked looking at the Landers twins).
After college, newly empowered with my own car, I bought an atlas collecting all 77 county maps in a single book: The Oklahoma Wildlife Federation's County Maps and Outdoor Guide to Oklahoma. The counties were each squeezed down to a single page, two at most, which made the maps hard to read at times, but it still was a helpful companion on my Saturday rambles around the state. I'd look for paved routes that were off the state numbered highway system: a shortcut from Skiatook Lake to Prue, Kenwood Road in Mayes and Delaware Counties, the road from Oaks to Rocky Ford to Moodys in Cherokee County, Jones and Hogback Roads in Oklahoma County. The atlas was also handy for spotting old highway alignments, like old US 75 as it winds through Vera, Ramona, and Ochelata, another segment of old 75 from Beggs to Preston to Okmulgee, and US 62 through Headrick, Snyder, Indiahoma, and Cache -- places where a beeline connecting cities 50 miles apart replaced the twists and turns that connected one little town to its neighbor.
Some years later, Shearer Publishing incorporated data from these ODOT county maps with topographical data to produce The Roads of Oklahoma, a full-color atlas with a consistent scale throughout.
So it was nice to see that ODOT now has the full set of county maps online, along with the current official state highway map and other publications.
I learned about these online maps from a fascinating new blog about our great state: blogoklahoma.us. And I learned about blogoklahoma.us from Mike of Okiedoke's latest Okie roundup.
The Map Room links to Hipkiss' Scanned Old Maps. The site owner is scanning and posting maps from books in his collection, like this map of London, suburbs, railways and postal codes, from the 1922 Bartholomew Pocket Atlas. He also has links to other online collections of maps old and new, and offers an RSS feed, so you can easily find out when he has a new map available for your perusal.
There's a new blog called Mapping Hacks, which is also the name of an upcoming book from O'Reilly Associates. The focus of blog and book is the democratization of mapmaking. I've long had the yearning to make my own maps, particularly for political purposes, but the tools for the task have been expensive and cumbersome to learn. That's all changing, and the open source revolution is behind the change.
A couple more cool map links:
Here's a collection of historical maps of Ireland. These maps will be especially helpful for someone working on Irish genealogy. The collection includes maps of Irish baronies, which have been hard to find outside specialist libraries.
And here's an online British Museum exhibit called "The Unveiling of Britain," revealing through maps the evolution of the understanding of Britain's shape from A.D. 800 to A.D. 1600.
Hat tip for all of the above to The Map Room.
From the headlines to tonight's bedtime reading:
"That's the worst of girls," said Edmund to Peter and the Dwarf. "They never carry a map in their heads.""That's because our heads have something inside them," said Lucy.
-- from Chapter 9 of Prince Caspian, by C. S. Lewis
(Hat tip to Captain's Quarters for the link to the CNN story above.)
This is pretty cool. Someone has tried to combine all the various transit services in the NYC metro area on a single diagram (not a scale map), in the fashion of the London Underground diagram. The standard maps from the various transit services (MTA, NJ Transit, Port Authority) generally only show you their own services, so it's useful to know -- for example -- that you can drive in from the Jersey burbs, park your car near the Lincoln Harbor development in northern Hoboken, take a Hudson-Bergen Light Rail car to Hoboken station, then catch a PATH train to Herald Square for some shopping at Macy's, then hoof it over to Penn Station for Amtrak to anywhere.
Could've used this a week or so ago.
[Hat tip to the Map Room.]
Found some wonderful London Underground map links and a blog devoted to maps.
The Map Room features links to all sorts of maps. Recent entries (here, here, here, and here) focus on our recent elections, with links to maps that present election results in creative ways, like this New York Times map which uses population density to show red and blue America in a way that may be somewhat less scary to the blue blue voters.
The Map Room also links to an archive of maps of the London Underground from 1905 to the present, and to this Grauniad article about Henry Beck, the man who designed the distinctive Underground diagram.
Speaking of the Underground, you can find another tube map archive here, the rules for the game Mornington Crescent (and a simplified Java version) here, and a funny but practical "Ultimate Guide to the London Underground" here. The London Transport Museum has an online shop, which offers among many other products customized clothes with your favorite station name or slogan. My favorites (and it is my birthday, hint hint) are a London trivia game with the tube map as the game board, and a CD containing the TrueType and Postscript versions of the Johnston font used on Underground maps and literature. (The font in the logo for this site is Gill Sans, which is similar but not an exact match for Johnston.) (The font is available less expensively here.)
The parade of nations, opening the Olympic Games in Athens, is being conducted in alphabetical order according to the Greek name for each nation. I took a couple of semesters of Greek in college, so I wasn't surprised to see the "Saint" countries at the front of the line, with places named for female saints (e.g. St. Lucia) preceding places named for male saints (e.g. St. Vincent, San Marino), because the Greek word for "Saint" is also the word for "holy": Άγία (hagia) is the feminine nominative singular form of the adjective, Άγιος (hagios) is the masculine equivalent. That little quote mark in front of the alpha -- a rough breathing mark, actually -- is sounded as English "h", and sometimes proceeds a vowel at the beginning of a word, but doesn't affect the alphabetical order. The "Z" countries get to come much earlier than usual -- zeta is the 6th letter of the Greek alphabet, while countries beginning with "Ph" or "F" come near the end, because phi is the 21st letter.
More puzzling was seeing some countries whose names begin in "B" in English in the expected order -- Belgium, Bermuda, Bosnia, Bolivia, Brazil -- while others marched in the midst of the Ms -- Barbados, Bahamas, Belize, Benin, Botswana. I caught a glimpse of one of the country name signs, and it looked like the Greek version of the names of the latter group began with ΜΠ -- "mp" if we wrote it in the Roman alphabet.
A quick Google turned up this list of country names in Greek. Barbados in Greek is Μπαρμπάντος -- Mparmpantos. Botswana is Μποτσουάνα -- Mpotsouana.
The only explanation I can think of for this is that in modern Greek, beta is pronounced closer to the English "v" (Vietnam and Vanuatu got to march close to the front with the rest of the beta nations), so the mu-pi combination may be the only way to represent the wholly foreign sound of an English "b".
Incoming Signals links to a proposal for reforming the Electoral College by redrawing state lines so we end up with 50 states of equal population, thus reducing the slight edge given to small states in the allocation of electoral votes. (It would also mean the end of small-state powr in the Senate.)
I remember being fascinated, as an eighth grader, by the entries in the People's Almanac about alternatives for subdividing the United States. One plan, by geographer G. Etzel Pearcy, split the US into 38 states, with lines drawn to keep metro areas within a single state. Pearcy believed there would be less government spending by reducing the number of state governments. He also believed that uniting each metropolitan area within a single state would simplify providing services on a regional basis -- the sort of thing now routinely accomplished through multilateral agreements between states, such as the Port Authority of New York and New Jersey.
I won't ridicule these efforts -- I spent a fair amount of time the summer after my eighth grade year devising my own plan. As I grew older, I came to appreciate the fact that states under our Constitution are not meant to be mere administrative arms of the Federal government, even if they often take that role. And despite the metropolitan identity that may cross state lines around major cities, those state lines mean something after existing for hundreds of years. Different laws have been in place and those have affected how people live and how people think about themselves.
The author of the Electoral College reform plan suggests redrawing state boundaries after each decennial census to retain equal population. This would put an end to the ironic observation that the U. S. Senate races are more competitive than House races, and therefore the make-up of the Senate better reflects changes in public mood because you can't gerrymander state lines.
Here's another effort at redrawing state lines for equal population, using existing state boundaries as much as possible.
Instapundit linked to a Doc Searls entry about the new liberal talk radio network. The article includes an interesting digression about AM radio propagation and has links to radio-locator.com, a database of information about broadcast stations in the USA. Each entry includes the station's website and the URL of any streaming broadcast, transmitting power, number and location of towers, ownership information, and -- this is the cool part -- links to daytime and nighttime coverage maps. Here's the entry for 1170 KFAQ. Advanced search will allow you to find all the stations with a certain frequency, and will do a fuzzy search around a frequency. There's even a mobile edition for downloading info to your PDA.
The coverage maps only show propagation of the ground wave, so if you remember Billy Parker's ads for the 50th anniversary of KVOO (now KFAQ) and the reference to "38 states, Mexico, and Canada", you'll be disappointed.
AM radio. Maps. These are a few of my favorite things.
Here's another city with an online, map-based way to browse property information. Wichita's system lets you drill down to the block, look at age, value, and ownership of property, zoning district, when annexed, and more. There are even convenient hyperlinks to the city zoning code, so you can see what a zoning designation signifies.
When will Tulsa catch up to Wichita?
Note: This site is not Mozilla-friendly, so you'll have to use IE.
The University of Oklahoma has a great Geo Information Systems (GIS) website at http://geo.ou.edu. Free maps available include municipal boundaries, school district boundaries (statewide and by county), county precinct maps, and maps relating to the oil and gas industry. There's also geographical boundary data that you can download and use in your own mapping applications.
Remember me pointing out Savannah's wonderful land use database, called SAGIS, which layers real estate ownership and valuation, aerial photos, zoning districts, and about any other bit of useful geographical information all in one map browser? The GIS department at OU was involved in that project, merging data from city, county, and regional government sources! Wouldn't it be nice if Tulsa would get OU's GIS department to do the same thing for us?
Andrew Sullivan links to this fascinating map, showing the balance of contributions to Republican and Democrat presidential candidates by three-digit zip code region. You can also look at the same data by state and by county and see for each candidate where their money is coming from -- just use the pulldown menu to change candidates. Elsewhere on the site are rankings showing who's pulling money from the grassroots and the fat cats. Bush draws well from both grassroots -- measured by the number of small donations -- and fatcats. Lieberman and Kerry have the wealthiest donors on average.
So far most of the money donated from Oklahoma is going to Democrats, particularly Lieberman, Dean, and Edwards.
The Tulsa County Assessor's office has online maps showing school districtboundaries and municipal boundaries. More impressive is the collection of maps showing subdivision boundaries, lot and block numbers, and lot dimensions. Each square mile is an Adobe Acrobat file.
It's nice to have those maps there, but I'm really impressed with SAGIS, the Savannah Area Geographic Information System, which allows for zooming in and out, and you can click on a lot and find out who owns it, what it's worth, how big the lot is, how it's zoned, and even who the city alderman and county commissioner are for that location. Another click takes you to the property card, with the physical characteristics of the buildings on the property. You can control layers of information on the map, and see property lines and zoning lines overlaid on an aerial photo. This is a great tool for property owners and potential buyers and investors. I hope we can get something like this for Tulsa very soon.
See a strange area code on caller ID? The website of NANPA (the North America Numbering Plan Administration) is the place to search for information about area codes, find up-to-date area code maps for North America, and up-to-date info on recent and upcoming area code splits, and on the dialing rules in each area. Where can I use 10-digit dialing? Where must I dial all 10 digits?
Remarkably, 13 states -- mostly in the Mountain West and in New England -- and DC still are managing with a single area code.
And here's a site with the history of area code numbering. Oklahoma became a two-area code state when 918 was created in 1953 (mandatory in 1954). The rationale behind the original numbering -- most populous areas got the fewest pulses -- New York had the most favorable area code, then Chicago and Los Angeles.
The University of Texas has a wonderful online collection of maps, both current and historical. One of the treasures to be found is the complete contents of Shepherd's Historical Atlas -- both 1923 and 1926 editions. I remember time spent poring over these detailed maps, marveling at the complexity of pre-unification Germany and wondering about the claims of the 13 colonies to western territories. (And Jefferson's proposal to organize the Northwest Territories as 10 states. Interesting that the proposed state of Metropotamia today has one of America's highest concentrations of Mesopotamians.)