Oklahoma voter registration maps and stats
Jamison Faught has posted maps of Oklahoma showing dominant party of voter registration by county and registration change per county, based on Oklahoma State Election Board statistics as of January 15, 2014. Only two small counties -- Harmon County in far southwestern Oklahoma and Coal County in Little Dixie -- showed percentage gains for the Democrats.
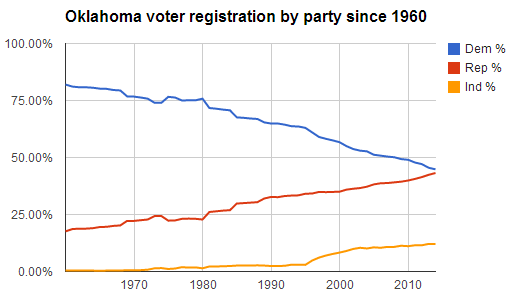
I took the state election board's spreadsheet for 1960 to 1995 and added the years since then to create this Oklahoma Voter Registration by Party spreadsheet.
There has been a steady trend for both major parties, with accelerations in the GOP's favor for each presidential election year, and a slight downward bend for both major parties when the Motor Voter act went into effect in the mid-1990s. (Independent is the default affiliation if none is marked on the registration application.) Republicans should be the plurality party in Oklahoma by the next presidential election. The one notable exception to the long term trend is the post-Watergate years -- 1974 to 1979.
0 TrackBacks
Listed below are links to blogs that reference this entry: Oklahoma voter registration maps and stats.
TrackBack URL for this entry: https://www.batesline.com/cgi-bin/mt/mt-tb.cgi/7126