Greenwood: October 2025 Archives
As the New Deal Federal Government got involved in encouraging home ownership and guaranteeing home loans, as banks and savings & loan companies failed in the Great Depression, the government commissioned studies of the state of residential real estate in major cities. In recent years, the maps drawn up by the Home Owners' Loan Corporation (HOLC) have been characterized as "redlining maps," a reference to the practice of "redlining," variously defined as blocking the sales of homes to African-American buyers to certain designated neighborhoods or withholding mortgage loans from buyers in predominantly black neighborhoods.
Hundreds of the HOLC maps are now available to view on the University of Richmond's Mapping Inequality website. The maps have been geotagged and overlaid on present-day interactive maps. There are nine maps online for Oklahoma: Tulsa, Oklahoma City, Miami, Muskogee, McAlester, Ada, Norman, Enid, Alva.
The HOLC City Survey Files, 1935-1940, are mostly available online on the National Archives website. The second report for Tulsa, Report of a Survey in Tulsa, Oklahoma, for the Mortgage Rehabilitation Division, Home Owners' Loan Corporation, was submitted on November 26, 1935, by field agent R. L. Olson.
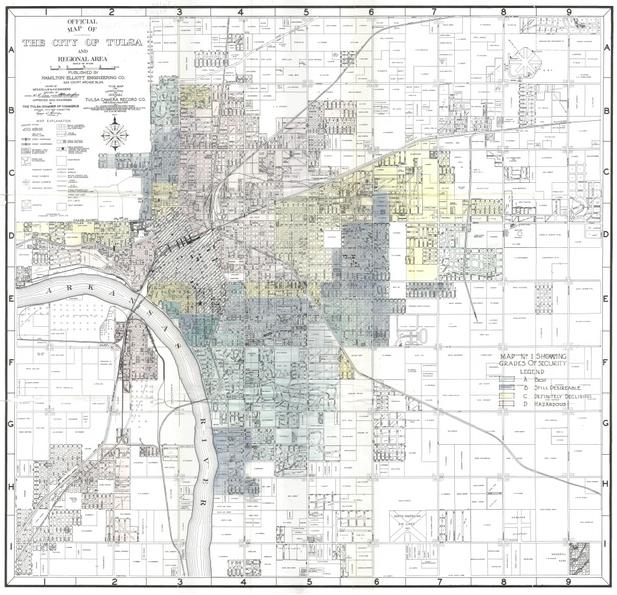
Here is the 1935 HOLC map of Tulsa, superimposed on a modern interactive map.
What I notice about the Tulsa map is that, although the black district is included in Zone D (Hazardous), so are all the white working-class neighborhoods to the northeast (Crutchfield, Springdale), immediately east of downtown (what we now call the Pearl District), Crosbie Heights west of downtown, and all the annexed towns west of the river (West Tulsa, Red Fork, Carbondale, Garden City), which were also almost exclusively white. The "Hazardous" classification appears to reflect proximity to industry and rail. Zone C (Definitely Declining) includes once desirable but aging neighborhoods like Owen Park, Brady Heights and the Near Northside, Riverview north of 15th, the western part of Kendall-Whittier (west of Columbia, north of Admiral), and Forest Orchard (between 11th & 13th, Peoria to Lewis).
Contrast Tulsa's map with Omaha's, where only black neighborhoods were included in Zone D. Wichita marked most of its older section, 58% of the residiential area, as hazardous, including areas that had been prosperous and well-regarded 40-50 years earlier. (Wichita has much more specific descriptions of individual zones and subzones.)
The entire 1935 Tulsa HOLC report is on the National Archives website, but it is arranged back-to-front -- the last page of the online file is the title page of the report.
Olson describes the classifications on the Tulsa map as conservative.
Nine of the leading authorities in real estate in Tulsa gathered at the office of the real estate board and agreed upon the designations shown upon the map. Their names are attached to the map. All portions of the city were later visited by the interviewer making this report and it was noticeable that the grades of security designated by the real estate men were very conservative. Tulsa, being new, has a better class of homes throughout than other cities comparable in size. Grades B [Still Desirable] and C [Definitely Declining] shown upon the map could, without dispute, be considered A [Best] and B respectively.
The August 1936 issue of the Federal Home Loan Bank Review contains a three-page article, "Security Maps for Analysis of Mortgage Lending Areas," that explains the reasons for creating such maps and the characteristics of the four graded areas. The point was for a lender to have an idea of whether a mortgaged property was likely to increase in value, retain value, or decline in value over the term of the mortgage, and to take that into consideration when deciding how much to lend and what proportion of a home's value was safe to lend.
The HOLC report is a fascinating snapshot of Tulsa's 1935 economy -- skilled labor rates, tax rates, unemployment, vacancies, construction costs, bank assets, population trends.
Tulsa has no slum areas. The city was considered for the location of a low cost housing or slum clearance project, as a political sop, but real estate men advised that this was discouraged because of absence of demand or a need for it.
1935 was near the end of Tulsa's streetcar system (although the Sand Springs Railway would continue to operate for another decade and a half). The report mentions a streetcar line north and south on Main Street, run by the United Service Company, with buses to other parts of the city, and that the Union Transportation Company (likely the successor to the Oklahoma Union Traction Company) was "operating only buses." "Only 12 minutes is consumed in the average ride to the outskirts, from the business district." A decade or so earlier, the Tulsa Street Railway had four streetcar lines, including service to Owen Park, Riverview, and the University of Tulsa, while Oklahoma Union Traction served the Fairgrounds and Owen Park, in addition to interurban service to Red Fork and Sapulpa.
In 1935, Tulsa had four banks, all national banks: First National Bank, National Bank of Tulsa, National Bank of Commerce, and Fourth National Bank. National Bank of Tulsa was the successor to Exchange National Bank, Tulsa's only bank failure, which had been reorganized in 1933 with the financial support of local oilmen and no losses to depositors.
Here is the page of the report containing Grades of Security map showing the four areas. The base map shows subdivisions, streets, schools, churches, parks, and civic buildings, which are indexed on the right side of the sheet.
The discussion of neighborhood trends notes the desirability of Osage County near downtown Tulsa, but the legal difficulties in developing the area.
The report had this to say about Greenwood and some of the other areas labeled D:
The negro section of Tulsa is very definitely defined upon Map No. 2. The section lies north of the Frisco railroad tracks, the eastern extremity being Peoria Avenue, the western boundary being Detroit Avenue on the southwest and Cincinnati Avenue on the west. North of the present restricted colored area is some room for expansion which will undoubtedly be required in the near future.To the north and east of the negro section are the homes occupied by wage earners and workers. Across the Arkansas River, in the southwest corner of the city, are two industrial residential sections, both in the vicinity of the refineries.
I never found a Map No. 2 in this file; Map No. 1 is the Grades of Security map.
Appendices include statements of condition for banks and savings & loan companies, summaries of interviews with leading bankers and real estate men. Statistics in the main body of the report include numbers of homes built each year through the 1920s boom and numbers of foreclosures. 1928 was a peak year, with 1337 new homes built, but the numbers fell precipitously after Black Friday, and from 1932-1934 the numbers were only in double digits.
Valuation shrinkage of Tulsa residential real estate was estimated to be between 30% and 50%, with the worst shrinkage at the top end of the market:
By 1930 the city had an unusually large number and percentage of homes, constructed in the boom days, at prices ranging from $25,000 and up to $100,000. When oil brokers and so called "gamblers" were forced to abandon such homes there was no sale for them whatever. Many were offered for 25% of their former value or cost. As a matter of fact the prices paid for these homes did not represent true or actual values because in the hey-day of Tulsa's oil boom there was a mad scramble for homes with very little regard to prices. Eliminating this class of property, which was very small in percentage as compared with the actual number of homes in the city, the shrinkage in value was probably about 40% as represented by sales during the depression.