Tulsa and Oklahoma historical maps and aerial photos
What was here? Who owned it? What did it look like? There are a number of resources available for reconstructing Oklahoma's geographical past, and they're easier to use than ever. These are my go-tos when researching the history of a neighborhood or answering questions about the past. This is an encyclopedic article, so if you're on the home page, you'll have to click the "Continue reading" link to see all of it.
These links will take you to specific sections of this article:
- Oklahoma Historical Aerial Digitization Project: Geotagged historical aerial photos going back to the 1930s
- Oklahoma Aerial Photo Inventory: A broader collection of imagery, including some not yet geotagged
- EarthExplorer: US Geological Survey aerial imagery: Higher resoution aerial photos from the 1950s through the 1970s, plus satellite and other imagery
- topoView: US Geological Survey historical topographical maps: Maps for Oklahoma from 1901
- US Bureau of Land Management Land Records: Township survey plats of Indian Territory from the 1890s, with field notes from the surveyors
- Oklahoma State University McCasland Maps Collection: Includes historical county highway maps as early as 1937, plus USGS topo quads not in the topoView collection
- WPA 1936 land ownership and valuation maps: Interactive statewide browser
- Tulsa Sanborn Fire Insurance Maps at Library of Congress: Building-by-building detail from Tulsa's earliest days through 1915, 1939, and 1962
- Tulsa Census Enumeration District and Census Tract Maps: Base street maps and boundaries of statistical neighborhoods
- Tulsa County Clerk Subdivision Plats and Deed Indexes
- Tulsa County Assessor Static Section Maps
- Miscellaneous Maps of Tulsa
Introduction: The Public Land Survey System
Foundational to nearly all the discussion below is the Public Land Survey System (PLSS), devised initially in the Northwest Ordinance to prepare the territories north of the Ohio River for settlement and statehood. All of Oklahoma has been surveyed by this system, which provides a permanent and consistent way of describing a location. Other land descriptions are derivative of PLSS: For example, the Carbondale townsite plat shows the subdivision of the NE 1/4 and W 1/2 of the SW 1/4 of Section 27, Township 19 N, Range 12 East into 24 blocks and anywhere from 21 to 40 lots in each block. The Cleveland County Assessor's website has a useful description of the rectangular survey system, including the concepts of standard parallels (correction lines) and guide meridians.
Oklahoma Historical Aerial Digitization Project
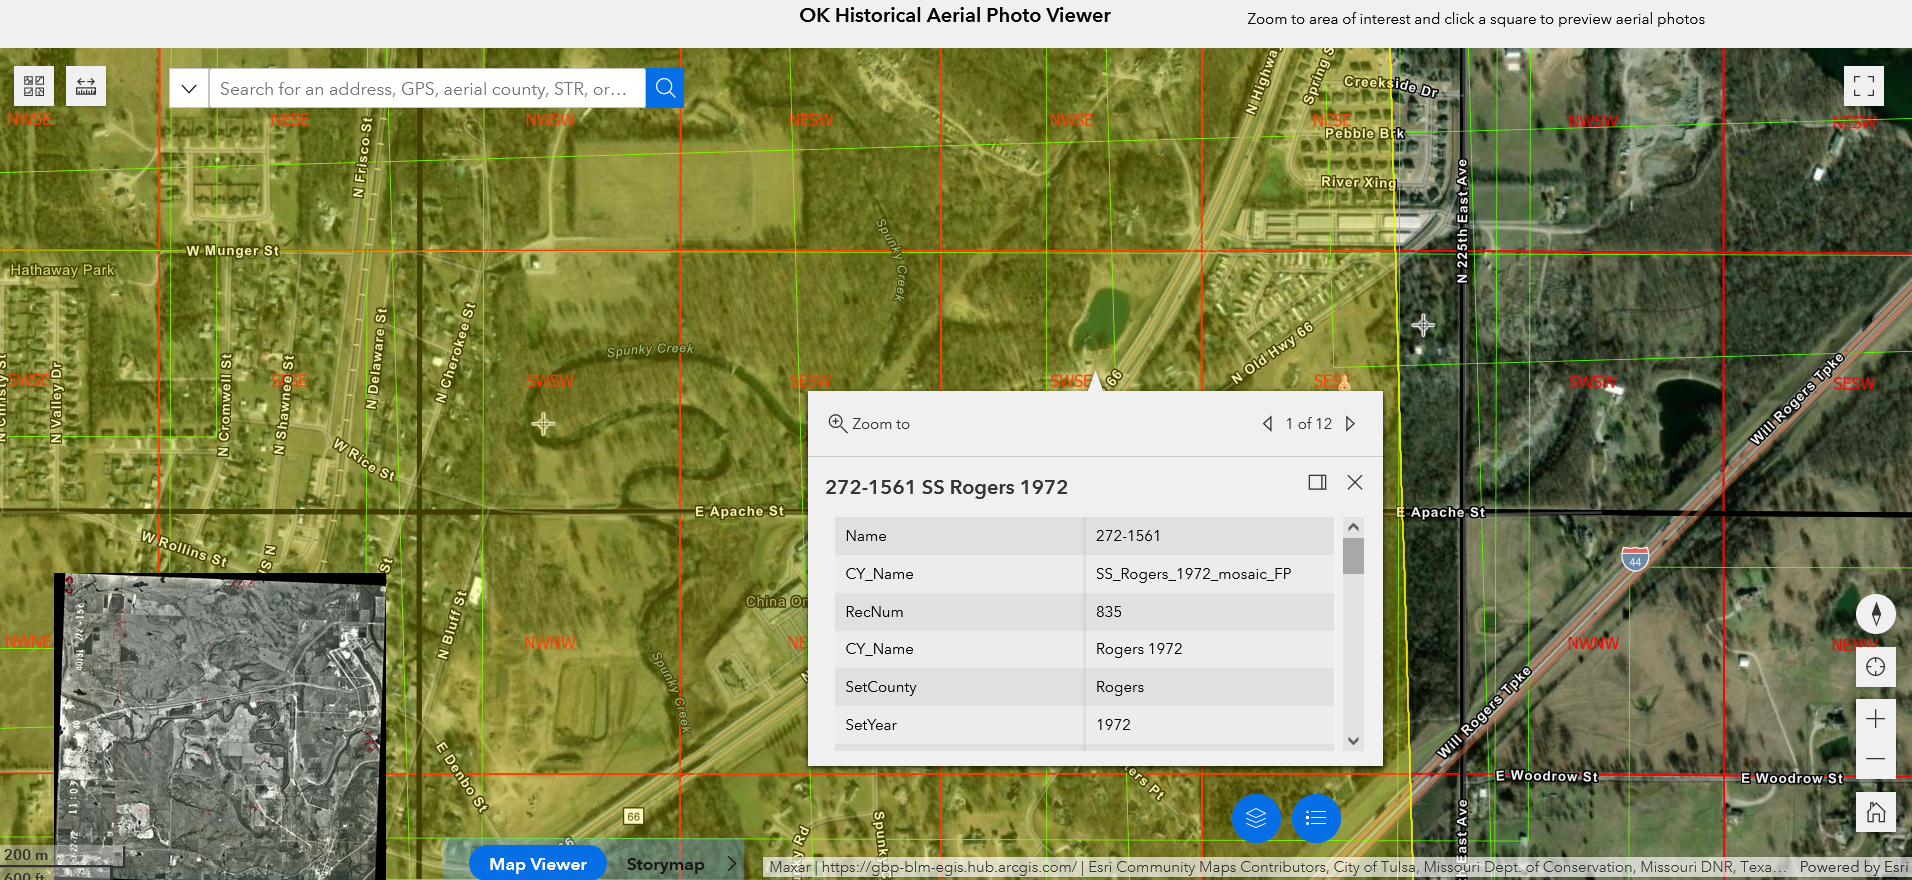
A project of the Oklahoma Corporation Commission to digitize their massive collection of aerial photographs from the US Department of Agriculture (USDA) and other sources, going back to the 1930s. It's a bit tricky to use, and I may do a video demonstration at some point, but here are the basics:
- Find the spot on the map of interest and click there.
- A box will popup with a table of information about one of the images of that spot.
- In the lower right of the box, there's a pair of arrows and "1 of X" between them, where X indicates how many aerials include that point.
- Use the arrows to scan through available imagery. The footprint of the image will be highlighted on the map, the year will appear in the table, and a preview of the image will appear in the lower left of the screen.
- If you want to view or download an image, scroll down in the box to the URL field, then right-click to open the image in a new tab or download it to your computer.
The information on the main page is well worth reading, describing the history of the project, the way aerial photographs were taken in the 1930s and 1940s, and a list of similar digitization projects in other states. A PowerPoint from 2017 is a good overview of the OHADP, why the Corporation Commission has all this aerials, the motivation for the project, and how to use it.
You will notice that the interactive map has lots of coverage for some counties and none at all for others. That reflects the process of geotagging each image in the inventory, but there are many more images available online that have yet to make it into the interactive map. For help in finding those:
Oklahoma Aerial Photo Inventory
An interactive map with info per county. You will need an FTP client, such as Filezilla, installed on your computer to follow the URLs provided on this map.
- Click on the camera icon for the county.
- Pop-up box shows the photo sets for that county and the acquisition status of each.
- Top left of the pop-up shows the number of sets.
- Top right of the pop-up has arrows for looking at details for each available set.
- If the photo set has been acquired, scroll down within the box to find the URL for the folder containing the photo set.
- Username and password for the FTP site are also shown in the box (okmaps_hp, spamk077)
Directories with INDEX_ at the beginning of the name will have mosaic photos showing image numbers, making it easier to find the image that corresponds to your area of interest.
The OHADP overview PowerPoint linked above has instructions for the FTP site and explanations of the directory names on pages 13 and 14.
- CorpCom/ - all photo sets; listed by county-year set name
- georefd/ - all georeferenced sets; organized by decade, then year, then set name
- OK_SS_Photos_FTP/ - all scanned-and-separated-into-townships sets; organized by decade, then year, then township (these are really just there to link to the OKMaps point shapefile, but feel free to download everything and rearrange them yourself if you'd like)
- OK_SS_Photos_FTP_old/ - same as above, but not updated anymore
- shapefiles/ - these are the point shapefiles you see on the OKMaps Data Viewer
- sns/ - all scanned-and-not-separated-into-townships sets; organized by decade, then year, then set name
The Corporation Commission archives don't have all available aerial photos. For example, the high-resolution aerial set for Tulsa from 1967 and high-resolution photos from the mid-1950s for rural areas around Tulsa are available on the US Geological Survey's EarthExplorer website. These are typically higher-quality images, and in uncompressed TIFF format, but correspondingly bigger files.
The Oklahoma Geological Service website has an Excel inventory of their collection of historical aerials by county and year. All the sets listed appear to be on the Corporation Commission's FTP server as well.
EarthExplorer: US Geological Survey imagery
There is a lot of information here, including wide area satellite imagery, but these instructions will focus on historical aerials. You will want to register for a free account, which will allow you to download high-resolution scan images. You must be logged in to activate the download buttons. There are four tabs on the left hand side that you will visit in sequence:
Search Criteria:
- Where: Specify place name, specify lat/long, drop a pin on the map, zoom in to an area of interest, or even upload a shapefile to define the area. The search will find all imagery that overlaps with the user-defined point or area.
- When: Scroll down to specify a Date Range. I usually set the end date as 1/1/1980, because most of the aerial photos I'm interested in are much earlier than that.
Data sets:
- Expand "Aerial Imagery"
- Select "Aerial Photo Single Frames"
Additional criteria:
- I usually skip this tab, but you could for example, filter by scale to exclude low-res images.
Results:
- Thumbnails of images will appear in the left-hand pane.
- Each image has an acquisition date and scale -- the lower the scale number the better the resolution.
- Click the foot icon for the image to see its footprint on the interactive map.
- Click the download icon (middle of the nine) to get the download popup.
- Select between medium resolution (~18 MB) or high resolution (~80 MB).
- Downloaded images are compressed with gzip, a Unix/Linux utility; 7Zip is a Windows app that can decompress gzipped files.
The Tulsa Library website also has the USGS aerials for Tulsa County from 1954, 1957, and 1967. The 1967 series covers the urbanized section of Tulsa, while the earlier series cover only rural areas.
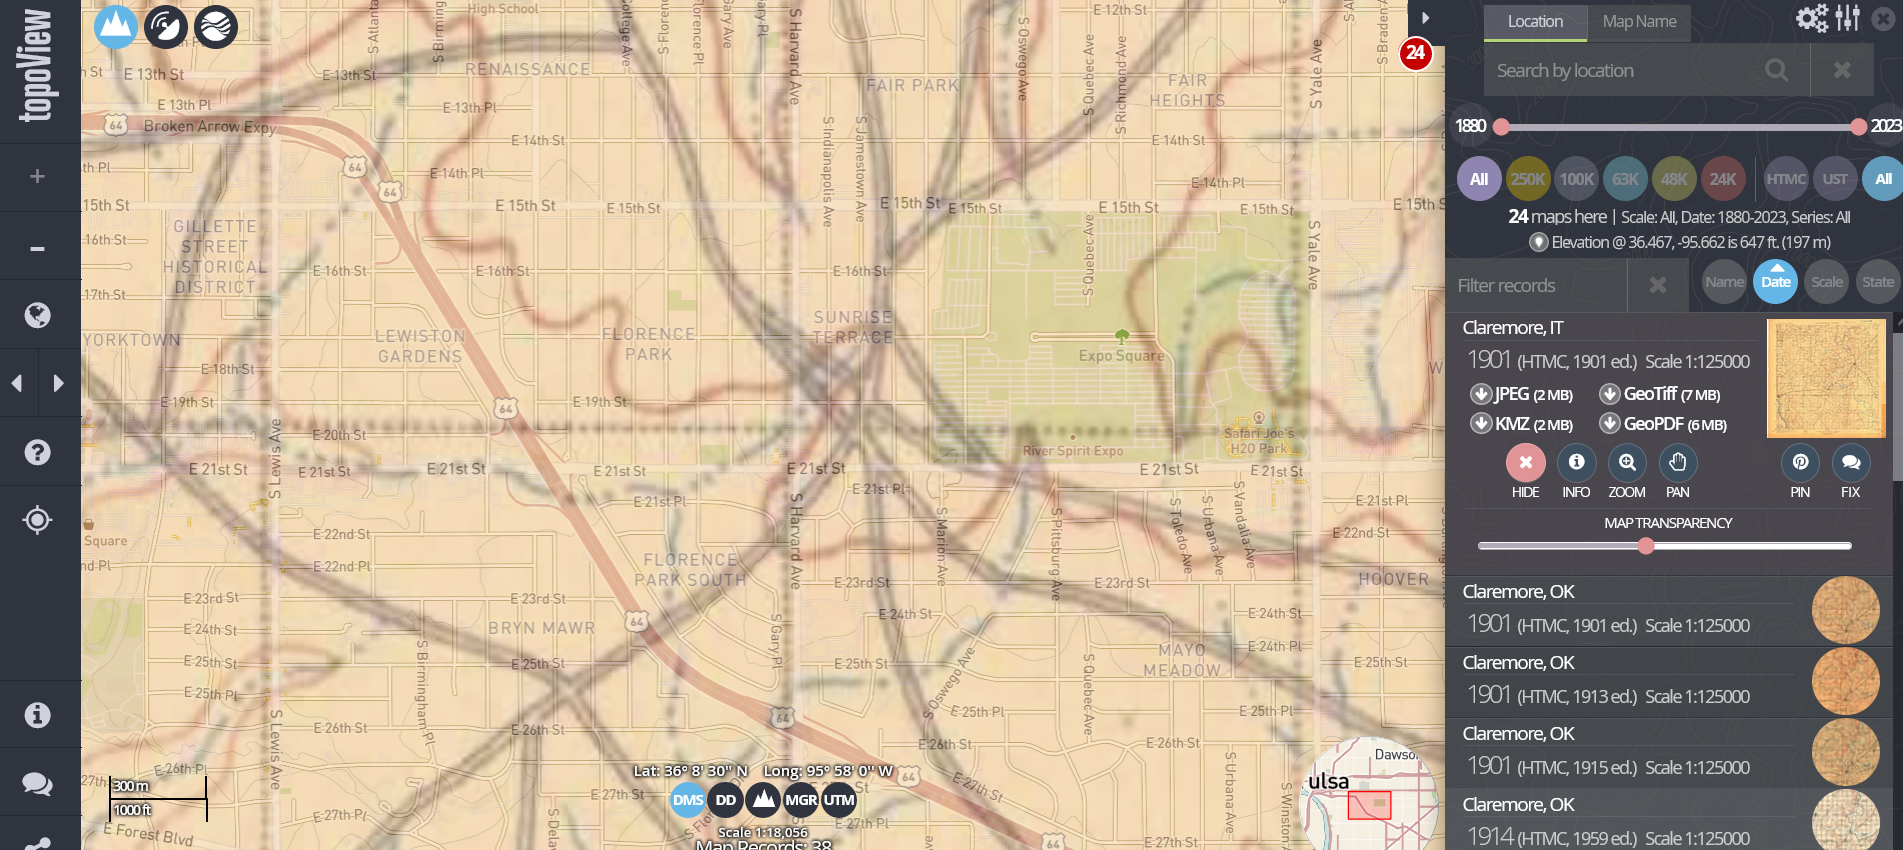
US Geological Survey Topoview: Historic Topographical Maps
Simple to use: Zoom in or search for your place of interest, and a list of available historic topographical maps will appear. For Tulsa, detailed quadrangles begin in 1953, but larger areas go all the way back to 1901. You can overlay the map on the modern interactive map and adjust transparency to see how vanished locations line up with the modern map. You can download maps in a variety of formats, including GeoTIFF and JPEG. More info on the project home page.
US Bureau of Land Management Land Records
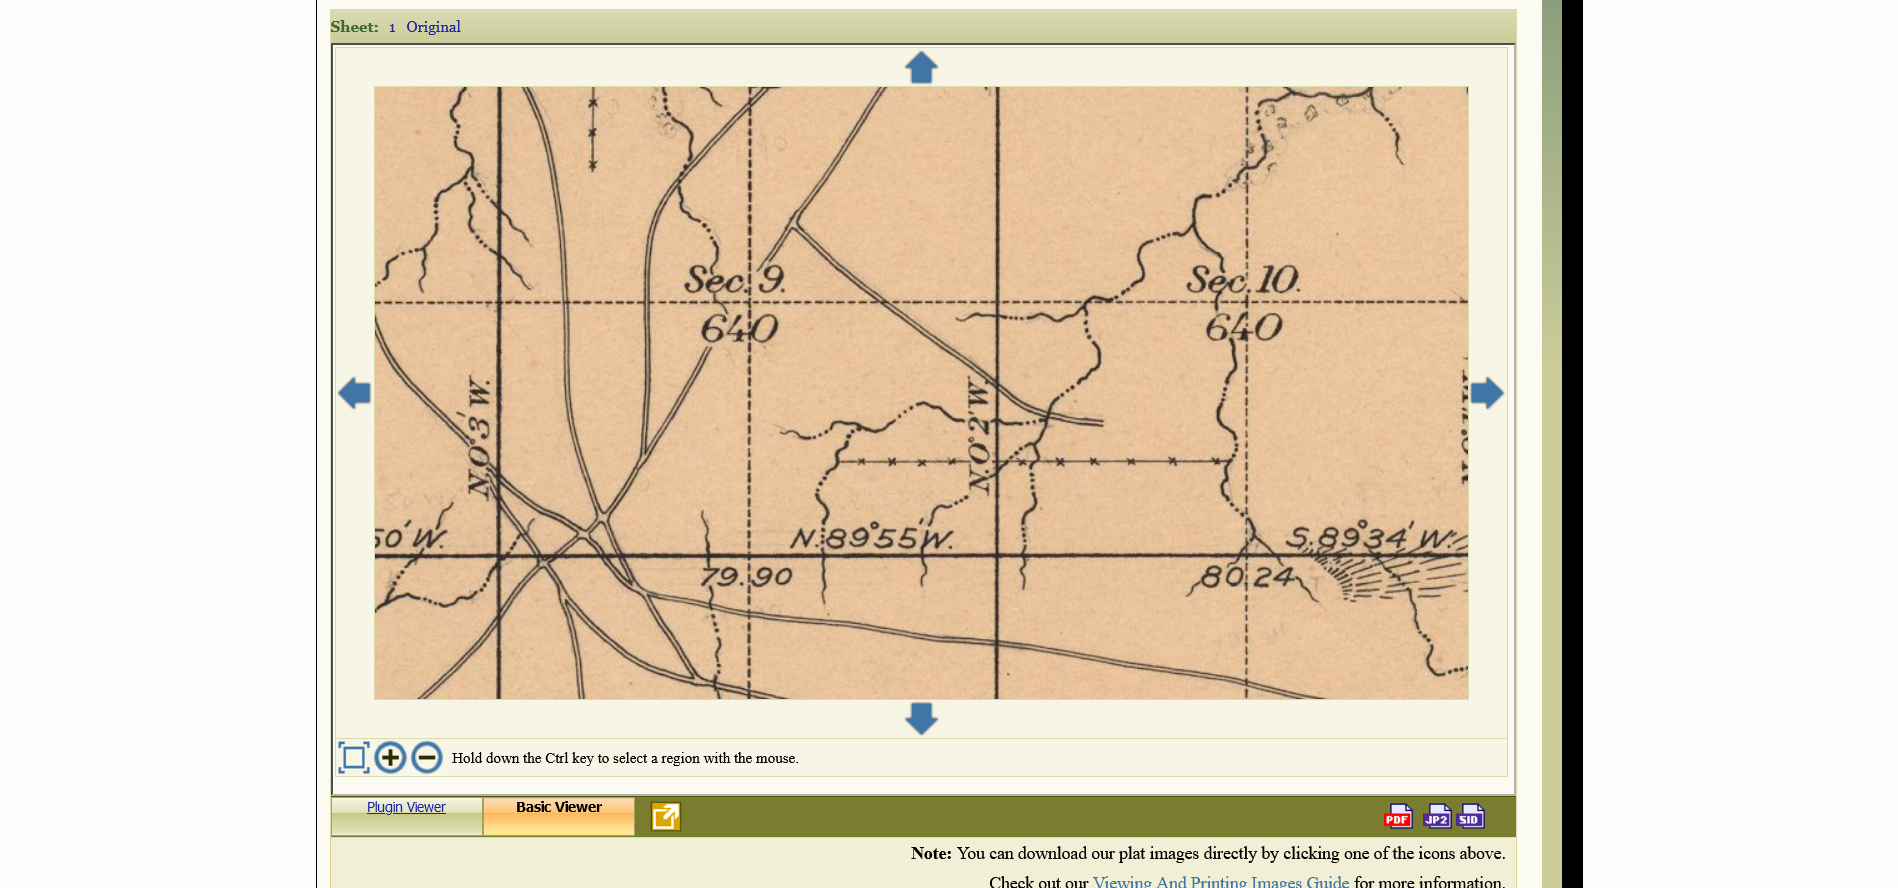
A map-based browser facilitates searching for land records from every state west of the Mississippi except Texas, plus the Northwest Territories states, plus Alabama, Georgia, and Florida. Documents of specific interest for Oklahomans are the notes and maps created by the surveyors preparing for allotment under the US Commission to the Five Civilized Tribes, popularly known as the Dawes Commission after its chairman. The maps show the location of homes and other improvements, roads, fences, cultivated fields, pastures, prairies, and woodlands.
On the top right, select Oklahoma, and type in the township and range of the 6 mile by 6 mile cadastral township of interest. For example, "19N 13E" is Archer to 61st Street South, Peoria to Mingo. Tabs will appear above the map and next to the Map tab. The Survey tab will show a list of surveys affecting this township; for this township there was a general survey and also surveys of the northern boundary of the Creek Nation and of the 3rd Guide Meridian East, both of which passed along an edge of the township. The 3rd Guide Meridian East is a N-S line 72 miles east of the Indian Meridian, the principal meridian for all of Oklahoma except the panhandle. The surveys for this township were performed in 1896.
On the individual survey page, there is a tab for Survey Plat details and the Plat Image, which shows the map. The Plugin Viewer uses the obsolete LizardTech ExpressView Browser Plug-in, which doesn't work for me, but the Basic Viewer works fine, and you can download the images as PDF, JPEG 2000 (JP2), or MrSID formats.
For each survey there is a set of handwritten field notes. This are linked under the Survey Plat tab. Here are the notes for the general survey, the Creek boundary survey and the 3rd Guide Meridian East survey. Distances are usually given in chains; there are 80 chains in a mile.
Instructions to Surveyors General, published in 1871, explains the process surveyors were to follow in the field and gives examples of maps and field notes. The instructions on how to find magnetic variation ("the variation of the needle") are fascinating.
A massive collection of maps, including many street maps of Oklahoma cities and towns, plus (my favorite) General Highway Maps for counties, dating back to the 1930s, which show city and town limits, rural school, church, and community locations, and electric interurban routes. The complete set of WPA maps showing land ownership and valuation are also here, but the next entry will give you a better way to search for them.
Here are some examples of maps you'll find:
- Department of Highways county maps: Date uncertain, but certainly before 1920. Shows municipal boundaries, railroads, creeks, civil townships, cadastral townships and sections. The Noble County map is missing. The Department of Highways map for Tulsa County shows Kendall, Red Fork, and Dawson as separate municipalities. The county has its modern boundaries, after gaining territory from Wagoner and Rogers Counties. The Osage County map shows Denoya (aka Whizbang). The Oklahoma County map has Britton as a separate municipality and Grand Boulevard annexed as Oklahoma City's fenceline.
- General Highway and Transportation county maps: These began to be published in 1936 and show municipal boundaries, civil and cadastral townships, highways, county roads (and type -- paved, graveled, dirt), schools, post offices, rural settlements, railroads (including electric railroads). Some counties have multiple maps for a given year: Osage County is represented by four maps because of its immense land area, while Tulsa County often has a map showing the central part of the county in greater detail.
- School District maps from 1977 and 1978: These aren't labeled clearly, but these maps, many of them bearing an Oklahoma Natural Gas stamp, show school district boundaries and numbers, including portions of districts from neighboring counties, labeled with the initial of the county and district number. Here's one from Osage County and here's Tulsa County. The number in parentheses (e.g. V-18) appears to indicate the Vo-Tech District.
- Oil Lease Maps: County or district maps, mostly from Phillips Petroleum Co.
- Abstract Company county maps: Showing land owners, county roads, highways, and landmarks
"The U.S. Works Progress Administration Oklahoma Maps collection consists of over 2,300 maps produced by the Works Progress Administration in 1936 and sponsored by the Oklahoma Tax Commission. The maps indicate the ownership and provide valuation of rural land holdings across the state of Oklahoma." Each of these maps shows a 6 mile by 6 mile cadastral township with owner, value of land (L.) and improvements (I.) for every significant parcel outside of municipal limits. A cross through a parcel indicates tax-exempt, such as government owned land and allotted land still in the hands of allottees. Click on a township on this interactive state map, and a popup will show a preview of the map and a link that will take you to the page for the map in the McCasland Map Collection, where you can view the map in greater detail and download it if desired.
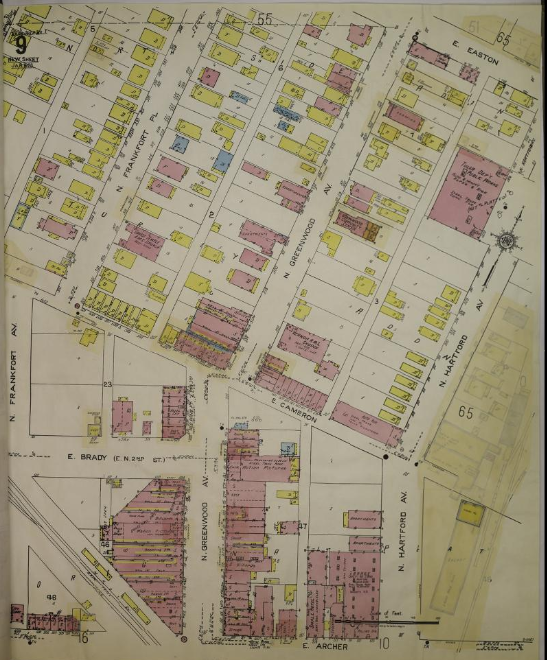
Sanborn Fire Insurance maps for Tulsa
The Library of Congress now has color scans of all available Sanborn Fire Insurance map sets for Tulsa: 1894, 1896, 1898, 1901, 1903, 1905, 1907, 1911, 1915, 1939, and 1962. Each set is a separate multi-image item. These maps show the outline, height, and material of almost every building in the city, including many areas since wiped out by expressway construction and urban renewal. The color scans make visible some details that can't be seen on the fax-quality black-and-white scans available through the Tulsa Library website. There's a catch, though: The Library of Congress has not yet scanned Volume 2 of the 1939 set or Volumes 2 and 3 of the 1962 set, so you're limited to what's west of Peoria. For the rest, have your Tulsa Library card number handy and login through their website to the ProQuest Digital Sanborn Maps for Oklahoma.
Tulsa County census enumeration districts and census tracts
Hathi Trust has a scan of the 1915 special census of Tulsa that Tulsa Commercial Club boosters paid the Census Bureau to conduct, to show the world how much the Magic City had grown since the 1910 census.
The National Archives has maps that were prepared prior to the 1940 and 1950 censuses, using current street maps as a base layer.
Tulsa's 1960 population statistics by census tract share a document with Tucson, Arizona, and Tyler, Texas, and include census tract maps on pages 123 and 124 of the PDF. The census document has population by race, age, marital status, as well as housing conditions and economic statistics.
Steve Morse offers a nationwide census Enumeration District finder that covers the 1870 through 1950 censuses, which allows you to navigate to census images.
The Tulsa Library digital collection also has Tulsa enumeration district maps from 1910, 1920, 1930, and 1940. The 1910 map shows ownership of the large parcels surrounding the city, including a great deal of land belonging to the extended Perryman family. I'm intrigued to see something called the St. Theresa Institute between 3rd & 4th, Elgin & Frankfort (later the site of Tulsa's first TV station, KOTV), and I'm curious about Rex Bismark Rentie, who owned 40 acres between Madison and Peoria on either side of present-day 6th Street.
Tulsa County Clerk Subdivision Plats and Deed Indexes
This is where to go to find out who owned what land and when. Shortly after taking office, Tulsa County Clerk Michael Willis began digitizing real estate records and making them available online. I go into more detail about the Tulsa County Clerk's records and how to use them in an article from 2018
Foundational to these records are Tulsa County Plats, which allow for land title to be described in terms of lots rather than fractions of a fraction of a fraction of a square mile section. Subdivision plats begin with the original townsites (O.T.) of municipalities like Tulsa and Broken Arrow, as well as municipalities since annexed, like Red Fork, Alsuma, and Dawson. The plats show block and lot boundaries, easements, covenants (e.g. Mayo Meadow restrictions on commercial activity and fences), original street names (e.g. Orcutt Addition, which shows 15th Street was originally called Cherry Street), and, in a few cases, the location of streetcar lines (e.g. Irving Place). The collection includes plats for subdivisions that no longer exist because of urban renewal, highway construction, and replatting, so they can be helpful for pinpointing long-lost addresses.
Platted Tract Indexes list by subdivision, by block, in chronological order all the recorded transactions (e.g., deeds, mortgages, releases), with marks in columns for each lot to make it quick to spot transactions for a particular lot of interest. Unplatted Tract Indexes provide the same information for farmland and acreages not included in any subdivision. Grantor/Grantee Indexes allow you to look up transactions within a range of a few years by the name of the party; records have been scanned through 1933 so far. Camera Record Images of deeds and other instruments are gradually being digitized and placed online.
Access to these records is under the Real Estate Services menu. Unfortunately, because of the website configuration and the disclaimer mechanism, I can't provide permalinks that will take you directly to these sections of the website.
Tulsa County Assessor static section maps
Sometimes you don't know the name of the subdivision you're interested in, or the boundaries between subdivisions. The Tulsa County Assessor's website has static maps by section (square mile) and quarter-section, showing subdivision names, and lot and block lines. Visit the interactive map, zoom into the area of interest, then click the download button at the bottom of the left column. Two more buttons will appear: The top one is for downloading a map of a section, the bottom for downloading a map of a quarter-section. Click your choice, then click the section of interest, then the quarter-section of interest, and the PDF for that map will load in your browser. These PDF maps have permalinks. For example, here is the map for Section 36 T20N R12E, which includes the Greenwood and Lansing neighborhoods that were wiped out by urban renewal. Some areas have been replatted, but the lots that were overlaid by expressways retained their subdivision names and lots, all now owned by ODOT.
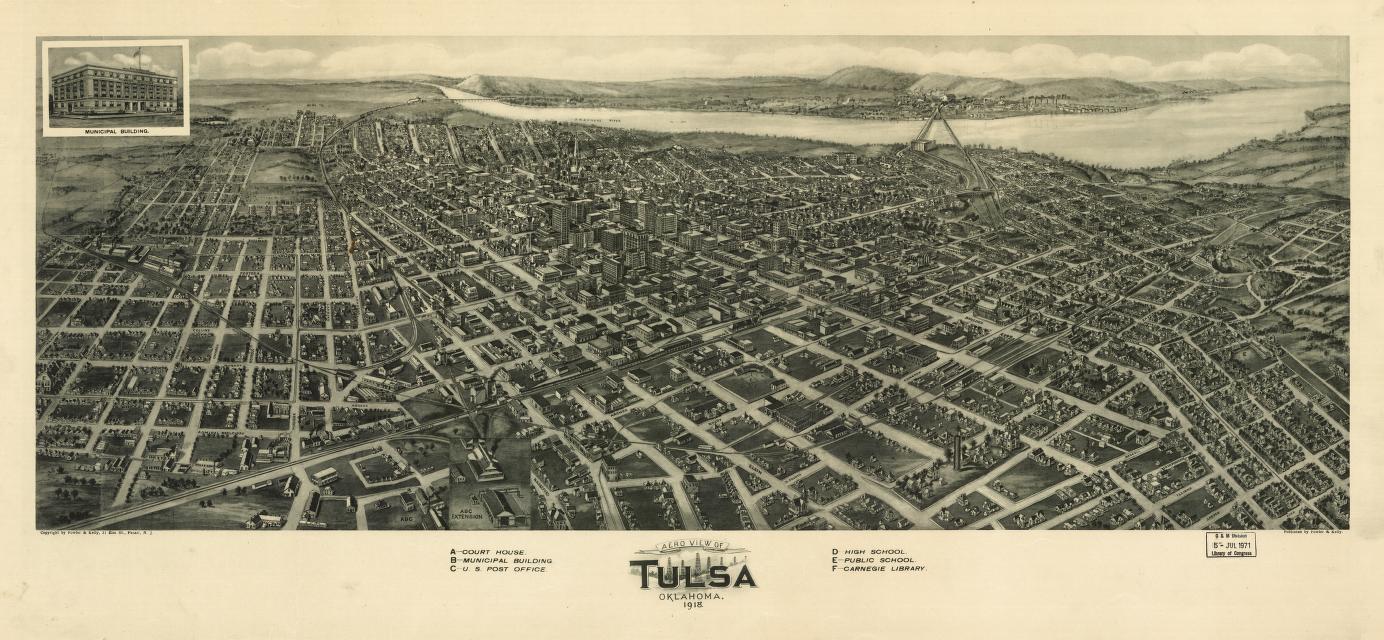
- Aero View of Tulsa, 1918 by Fowler and Kelly. Drawn from the perspective of a point in the air above the NE corner of downtown, looking SW toward the river and the hills beyond. Streetcar lines are shown, along with the growing number of tall buildings.
- 1915 map of Tulsa: Very high resolution scan, plus lower-res versions, showing city limits, subdivisions, streetcar lines, landmarks, parks, schools, and cemeteries.
- Tulsa's Industrial and Commercial District, a map in the University of Tulsa's 1921 Tulsa Race Massacre Collection, shows downtown in detail along with a map of the whole city with streetcar lines.
- Mid-1920s pocket map of Tulsa: On the Tulsa Library website, good representation of the city's streetcar network. It's after 1922, because that was the year that the Oklahoma Union Traction company removed its tracks from the St. Louis Ave. branch to Orcutt Lake Park.
- Undated Tulsa precinct map seems to be a few years earlier -- it has the Orcutt line.
- 1951 Ashburn's Tulsa city map: With inset of Alsuma. On the reverse, an index of streets and schools and an ad for Bekins Van and Storage.
- 1952 DX Ashburn's city map of Tulsa: With insets of downtown and Alsuma. On the reverse, a Tulsa county map, an index of streets and points of interest, and a map showing three self-guided Tulsa Tours: Industrial, Residential, and Scenic. Readers of a certain age will remember Tulsa Tours signs still on the streets in the 1970s. A different reverse side of the same map was sponsored by National Bank of Tulsa and has a map of downtown Tulsa buildings.
- 1959 DX city map of Tulsa: With insets of downtown and Sand Springs. Skelly Drive is complete, and the map shows proposed sections of the Mingo Valley, Gilcrease, and Broken Arrow expressways. On the reverse is a Tulsa County map, a Tulsa Tour map, and an index of streets and points of interest.
- 1963 Conoco Gousha street map of Tulsa: With inset of downtown. Shows Mingo Valley Expressway under construction to open late 1963, and the Broken Arrow Expressway under construction to open 1965 from Skelly Drive to Xanthus. On the reverse, a schedule of tolls on the Turner Turnpike and Will Rogers Turnpike, and a map of five day-trip tours starting from Tulsa.
- 1967 Gulf Rand McNally touring map of Tulsa and Oklahoma City: Shows partial completion of Mingo Valley, Broken Arrow, and Gilcrease Expressways. Oklahoma City is shown on the reverse.
- Oklahoma Restaurant Association Map of Tulsa, America's Most Beautiful City: Undated, probably from late 1960s. The reverse of the map has ads for ORA members including The Louisiane, Henry Jin's Ric-Sha, Sleepy Hollow, Black Gold Buffet, Camelot Inn, Powell's Restaurant, Sutphen's Family Barbeque, Golden Drumstick, Trade Winds, Pennington's Drive-In, Ward's Restaurant, Hilton Inn, Girlie Pancake House, Country Fare, Pagoda, and the six locations of Borden's Cafeteria. Photos celebrate the downtown skyline, Philbrook & Gilcrease museums, the Tulsa Rose Garden, and a collection of mid-century buildings: Tulsa International Airport, University Club Tower, the Assembly Center, the International Petroleum Exposition building.
- 1977 Arrow Map of Tulsa, Sand Springs, Bixby: I got this map when it was new and used it until it nearly fell apart. I was excited because it was the first city map I'd found that went all the way to the 1966 east boundary at 193rd East Avenue, close to where I lived. Most of the city maps above stop at Garnett or so, because they were just updating base maps from the 1950s, before Tulsa's massive eastward expansion. Far east Tulsa and several other cities were on the reverse (next entry in this list). Arrow Map is a Boston company, and four years later I was buying their excellent maps of Boston, Brookline, Cambridge, and the region, which had the benefit of local knowledge. Their Tulsa map lacked local information and depended too much on plats and official maps, which show subdivision streets that were platted and school sites that were planned but never built.
- 1977 Arrow Map of far east Tulsa and Broken Arrow, Bartlesville, Dewey, Muskogee, Owasso, Claremore, Sapulpa, Stillwater. Reverse of the previous map.
0 TrackBacks
Listed below are links to blogs that reference this entry: Tulsa and Oklahoma historical maps and aerial photos.
TrackBack URL for this entry: https://www.batesline.com/cgi-bin/mt/mt-tb.cgi/9120